echarts的时序图的做法

1.看到 时序图 真心不知道怎么做,但在网上查不到相关 时序图 的资料,其实时序图就是堆叠条形图的改良版,可能我说的不是很准确,但我个人感觉这样的做法是对的。

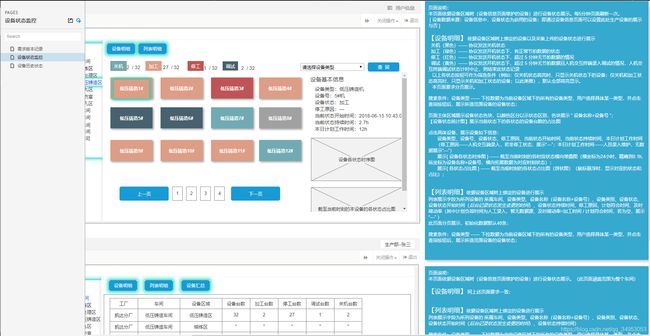
先看我需求
echarts的时序图的做法_第1张图片
这是我需求要求,要展示的时序图

上代码:在HTML中的代码

 
设备无状态
关机
加工
停工
调试
//时序图

在script中的代码块

initChart2(initData){//时序图
       var myChart1 = echarts.init(document.getElementById('main1'));
       var colors = ['rgb(220,220,220)','rgb(0,0,0)','rgb(0,204,0)','rgb(254,0,0)','rgb(254,166,80)']
       // 指定图表的配置项和数据
       var option = {
            title: {
                text: this.Yname//标题
            }, 
              tooltip : {
              trigger: 'axis',
              axisPointer : {            // 坐标轴指示器,坐标轴触发有效
                  type : 'shadow'        // 默认为直线,可选为:'line' | 'shadow'
              }
          },
           color:colors,
              /* legend: {
                  data: ['无状态','关机', '加工','停工','调试']
              }, */
              grid: {
                  left: '3%',
                  right: '4%',
                  bottom: '3%',
                  containLabel: true
              },
              dataZoom: [{
                    type: 'slider',
                    start: 100,
                    end: 1
                }],
              xAxis:  {
                  type: 'value',
                  name:'单位:小时',//在x轴的单位显示
                  nameLocation:'start',
                  nameTextStyle:{
                    padding:[7,7]
                   },
                  splitNumber:24,
                  max:24

              },
              yAxis: {
                  type: 'category',
                  data:this.Yname//这是y轴取到的数据跟标题一样
                  
              },
              series: initData,
               
           }
            myChart1.setOption(option,true);//这个作用就是每次调接口都会重新加载视图,(要不然会有bug)
    },

调接口的时处理的数据

 // 时序图的接口
      SXTposul(gd).then(response =>{
          console.log(response)
         if(response.data.code ===200){
            this.SXTrecord = response.data.data
             var initData = [];
             var colors = ['rgb(220,220,220)','rgb(0,0,0)','rgb(0,204,0)','rgb(254,0,0)','rgb(254,166,80)']
             //这个是动态加载**echarts**的**series**循环出来根据数据的多少有几条追加几条
            this.SXTrecord.forEach(item =>{
               if(item.equipmentStatus===0){
                   var dataCom = Array.of(item.continuTime) 
                   initData.push({
                      name: '设备无状态',
                      type: 'bar',
                      stack: '状态',
                      data: dataCom,
                      itemStyle: {
                          normal:{
                              color: function (params){
                                  return colors[0];
                              }
                          }
                      }
                  });
                }else if(item.equipmentStatus===1){
                   var dataCom = Array.of(item.continuTime)
                    initData.push({
                      name: '关机',
                      type: 'bar',
                      stack: '状态',
                      data: dataCom,
                      itemStyle: {
                          normal:{
                              color: function (params){
                                  return colors[1];
                              }
                          }
                      }
                  });  
                }else if(item.equipmentStatus===2){
                  var dataCom = Array.of(item.continuTime)
                       initData.push({
                        name: '加工',
                        type: 'bar',
                        stack: '状态',
                        data: dataCom,
                        itemStyle: {
                            normal:{
                                color: function (params){
                                    return colors[2];
                                }
                            }
                        }
                    });
                }else if(item.equipmentStatus===3){
                     var dataCom = Array.of(item.continuTime)
                    initData.push({
                      name: '停工',
                      type: 'bar',
                      stack: '状态',
                      data: dataCom,
                      itemStyle: {
                          normal:{
                              color: function (params){
                                  return colors[3];
                              }
                          }
                      }
                  });
                }else if(item.equipmentStatus===4){
                       var dataCom = Array.of(item.continuTime)
                      
                       initData.push({
                          name: '调试',
                          type: 'bar',
                          stack: '状态',
                          data: dataCom,
                          itemStyle: {
                          normal:{
                            color: function (params){
                            return colors[4];
                           }
                          }
                        }
                     });        
                }
                // this.Series.push(initData)
                setTimeout(() => {
                this.initChart2(initData)
                },200)
            })
         }
          this.Yname = []
          var nameConde =  this.SXTrecord[0].equipmentName +'\n'+ this.SXTrecord[0].equipmentCode
          this.Yname.push(nameConde)
      })

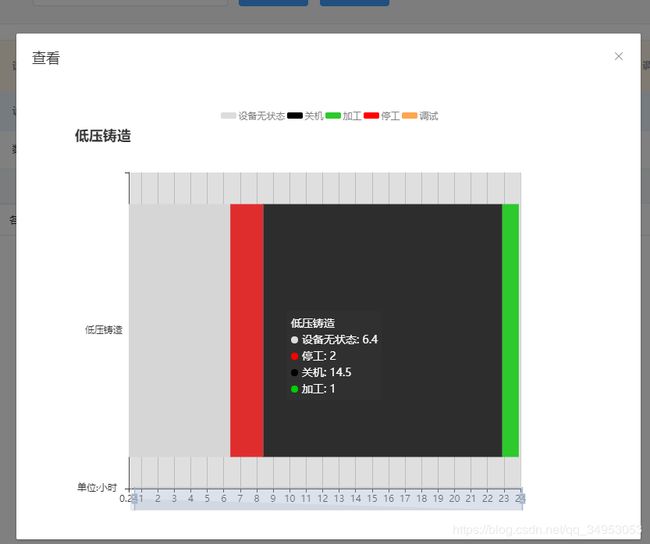
最后呈现的效果就是

echarts的时序图的做法_第2张图片
相同的道理可以做成弹窗的:
echarts的时序图的做法_第3张图片

你可能感兴趣的:(echarts图表相关)