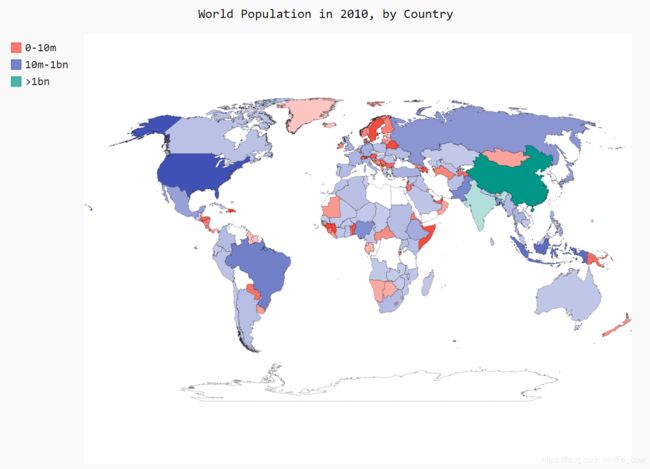
Python 数据可视化—下载数据(CSV文件格式、JSON格式)
Python 数据可视化-下载数据CSV文件格式、JSON格式
- 网上下载数据,并对这些数据进行可视化,可视化以两种常见格式存储的数据:
CSV 和JSON。 - 我们将
使用Python模块csv 来处理以CSV
1、CSV文件格式:
-
最简单的方式是将
数据作为一系列以逗号分隔的值 (CSV)写入文件。2019-1-5,61,44,26,18,7,-1,56,30,9,30.34,30.27,30.15,,,,10,4,,0.00,0,,195
1.1、分析CSV文件头:
-
csv 模块包含在Python标准库中,可用于分析CSV文件中的数据行,让我们能够快速提取感兴趣的值。import csv filename = './weather.csv' # 我再当前目录中创建了weather.csv 文件了 with open(filename) as f: reader = csv.reader(f) header_row = next(reader) print(header_row)-
导入模块csv 后,我们将要使用的文件的名称存储在filename 中
-
我们打开这个文件,并将结果文件对象存储在f 中
-
我们调用csv.reader() ,并将前面存储的文件对象作为实参传递给它,从而创建一个与该文件相关联的阅读器(reader )对象
-
我们将这个阅读器对象存储在reader 中
-
模块csv 包含函数next() ,调用它并将阅读器对象传递给它时,它将返回文件中的下一行。 -
我们
只调用了next() 一次,因此得到的是文件的第一行,其中包含文件头# 输出结果如下: ['AKDT', 'Max TemperatureF', 'Mean TemperatureF', 'Min TemperatureF', 'Max Dew PointF', 'MeanDew PointF', 'Min DewpointF', 'Max Humidity', ' Mean Humidity', ' Min Humidity', ' Max Sea Level PressureIn', ' Mean Sea Level PressureIn', ' Min Sea Level PressureIn', ' Max VisibilityMiles', ' Mean VisibilityMiles', ' Min VisibilityMiles', ' Max Wind SpeedMPH', ' Mean Wind SpeedMPH', ' Max Gust SpeedMPH', 'PrecipitationIn', ' CloudCover', ' Events', ' WindDirDegrees']
-
-
注意 :文件头的格式并非总是一致的,空格和单位可能出现在奇怪的地方。这在原始数据文件中很常见,但不会带来任何问题。
1.2、打印文件头及其位置:
-
为让文件头
数据更容易理解,将列表中的每个文件头及其位置打印出来:import csv filename = './weather.csv' with open(filename) as f: reader = csv.reader(f) header_row = next(reader) for index, column_header in enumerate(header_row): print(index, column_header) # 输出结果如下: 0 AKDT 1 Max TemperatureF 2 Mean TemperatureF 3 Min TemperatureF ————snip————— 19 PrecipitationIn 20 CloudCover 21 Events 22 WindDirDegrees- 我们对列表调用了
enumerate()来获取每个元素的索引及其值。
- 我们对列表调用了
1.3、提取并读取数据:
-
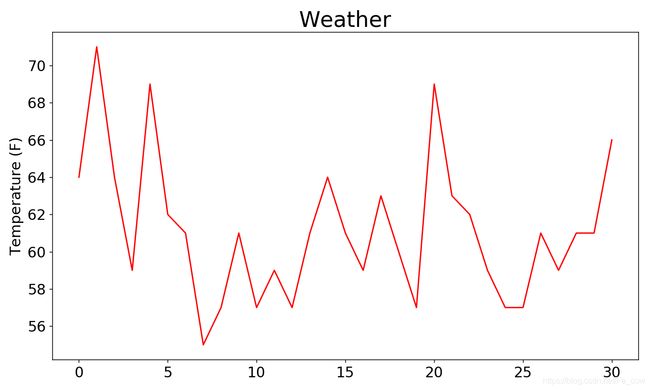
知道需要哪些列中的数据后,我们来读取一些数据。首先读取每天的最高气温
import csv filename = './weather.csv' with open(filename) as f: reader = csv.reader(f) header_row = next(reader) highs = [] for row in reader: highs.append(row[1]) print(highs) # 输出结果如下: ['64', '71', '64', '59', '69', '62', '61', '55', '57', '61', '57', '59', '57', '61', '64', '61', '59', '63', '60', '57', '69', '63', '62', '59', '57', '57', '61', '59', '61', '61', '66'] -
下面使用
int() 将这些字符串转换为数字,让matplotlib能够读取它们import csv filename = './weather.csv' with open(filename) as f: reader = csv.reader(f) header_row = next(reader) highs = [] for row in reader: highs.append(int(row[1])) print(highs)
1.4、绘制气温图表:
1.5、模块datetime:
-
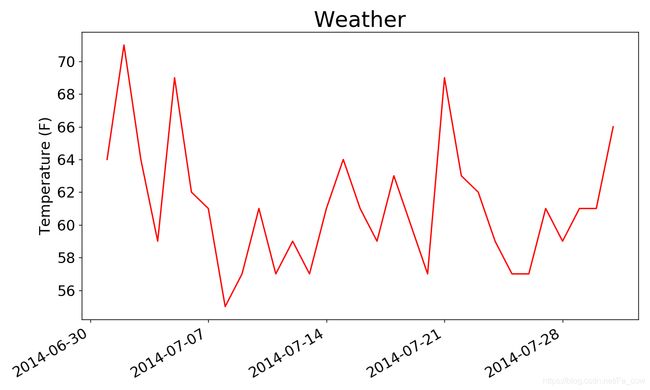
下面在图表中添加日期,使其更有用。在天气数据文件中,第一个日期在第二行:
-
读取该数据时,获得的是一个字符串,因为我们需要想办法将字符串’2014-7-1’ 转换为一个表示相应日期的对象。
-
为创建一个表示2019年1月1日的对象,可使用模块
datetime 中的方法strptime()from datetime import datetime first_date = datetime.strptime('2019-1-1', '%Y-%m-%d') print(first_date)- 我们首先导入了模块
datetime 中的datetime 类,然后调用方法strptime() ,并将包含所需日期的字符串作为第一个实参 第二个实参告诉Python如何设置日期的格式方法strptime() 可接受各种实参,并根据它们来决定如何解读日期
- 我们首先导入了模块
-
-
模块datetime中设置日期和时间格式的实参:
实参 含义 %A 星期的名称,如Monday %B 月份名,如January %m 用数字表示月份(01~12) %d 用数字表示月份中的一天(01~31) %Y 四位的年份,如2019 %y 二位的年份,如15 %H 24小时制的小时数(00~23) %I 12小时制的小时数(01~12) %P am或pm %M 分钟数(00~59) %S 秒数(00~61)
1.6、再图表中添加日期:
-
即提取日期和最高气温,并将它们传递给plot()
import csv
from datetime import datetime
from matplotlib import pyplot as plt


# 从文件中获取日期和最高气温
filename = 'weather.csv'
with open(filename) as f:
    reader = csv.reader(f)
    header_now = next(reader)

    dates, highs = [], []

    for row in reader:
        current_date = datetime.strptime(row[0], '%Y-%m-%d')
        dates.append(current_date)

        high = int(row[1])
        highs.append(high)

    # 根据数据绘制图形
    fig = plt.figure(dpi=128, figsize=(10, 6))
    plt.plot(dates, highs, c='red')

    # 设置图形的形式
    plt.title('Weather', fontsize=24)
    plt.xlabel('', fontsize=16)

    fig.autofmt_xdate()
    plt.ylabel('Temperature (F)', fontsize=16)
    plt.tick_params(axis='both', which='major', labelsize=16)

    plt.show()
1.7、涵盖更长的时间:
-
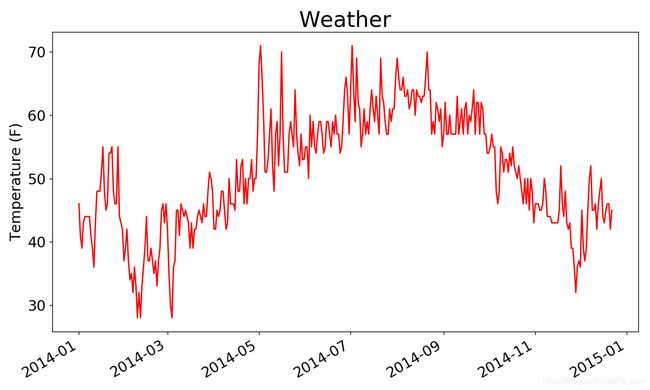
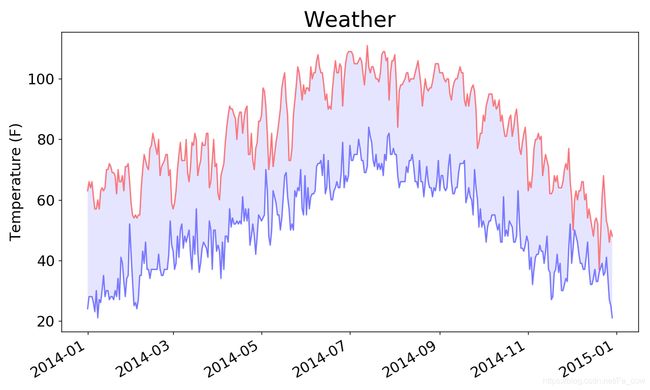
设置好图表后,我们来添加更多的数据,以成一幅更复杂的,导入一个weather_2014.csv的文件。
import csv
from datetime import datetime
from matplotlib import pyplot as plt


# 从文件中获取日期和最高气温
filename = 'weather_2014.csv'
with open(filename) as f:
    reader = csv.reader(f)
    header_now = next(reader)

    dates, highs = [], []

    for row in reader:
        current_date = datetime.strptime(row[0], '%Y-%m-%d')
        dates.append(current_date)

        high = int(row[1])
        highs.append(high)

    # 根据数据绘制图形
    fig = plt.figure(dpi=128, figsize=(10, 6))
    plt.plot(dates, highs, c='red')

    # 设置图形的形式
    plt.title('Weather', fontsize=24)
    plt.xlabel('', fontsize=16)

    fig.autofmt_xdate()
    plt.ylabel('Temperature (F)', fontsize=16)
    plt.tick_params(axis='both', which='major', labelsize=16)

    plt.show()
1.8、再绘制一个数据系列:
-
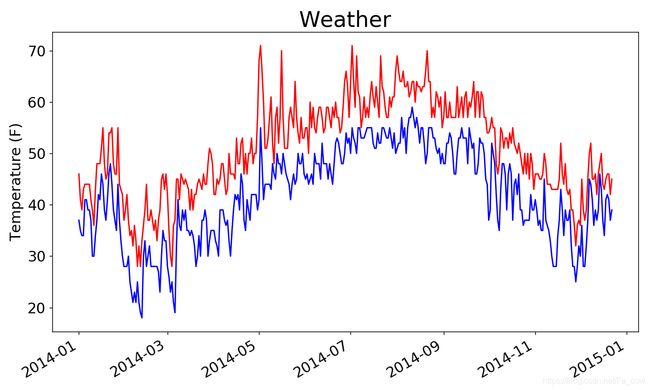
我们可以在其中再添加最低气温数据,使其更有用
import csv from datetime import datetime from matplotlib import pyplot as plt # 从文件中获取日期和最高气温 filename = 'weather_2014.csv' with open(filename) as f: reader = csv.reader(f) header_now = next(reader) dates, highs, lows = [], [], [] for row in reader: current_date = datetime.strptime(row[0], '%Y-%m-%d') dates.append(current_date) high = int(row[1]) highs.append(high) low = int(row[3]) lows.append(low) # 根据数据绘制图形 fig = plt.figure(dpi=128, figsize=(10, 6)) plt.plot(dates, highs, c='red') plt.plot(dates, lows, c='blue') # 设置图形的形式 plt.title('Weather', fontsize=24) plt.xlabel('', fontsize=16) fig.autofmt_xdate() plt.ylabel('Temperature (F)', fontsize=16) plt.tick_params(axis='both', which='major', labelsize=16) plt.show() -
再一个图表中包含两个数据系列
1.9、给图表区域着色
-
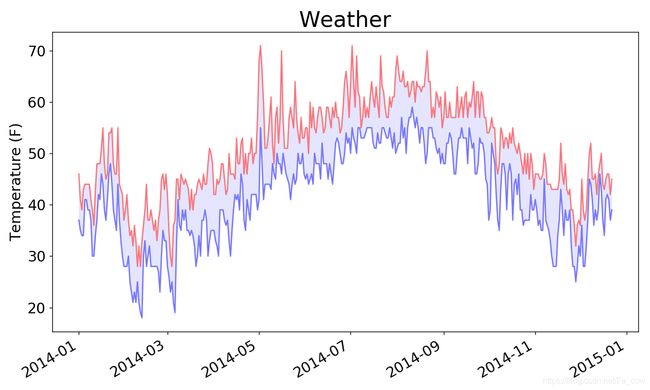
给这个图表做最后的修饰,通过着色来呈现每天的气温范围。
-
我们将
使用方法fill_between() ,它接受一个 x 值系列和两个 y 值系列,并填充两个 y 值系列之间的空间:import csv from datetime import datetime from matplotlib import pyplot as plt # 从文件中获取日期和最高气温 filename = 'weather_2014.csv' with open(filename) as f: reader = csv.reader(f) header_now = next(reader) dates, highs, lows = [], [], [] for row in reader: current_date = datetime.strptime(row[0], '%Y-%m-%d') dates.append(current_date) high = int(row[1]) highs.append(high) low = int(row[3]) lows.append(low) # 根据数据绘制图形 fig = plt.figure(dpi=128, figsize=(10, 6)) plt.plot(dates, highs, c='red', alpha=0.5) plt.plot(dates, lows, c='blue', alpha=0.5) plt.fill_between(dates, highs, lows, facecolor='blue', alpha=0.1) # 设置图形的形式 plt.title('Weather', fontsize=24) plt.xlabel('', fontsize=16) fig.autofmt_xdate() plt.ylabel('Temperature (F)', fontsize=16) plt.tick_params(axis='both', which='major', labelsize=16) plt.show()
1.10、错误检查:
-
但有些气象站会偶尔出现故障,未能收集部分或全部其应该收集的数据。
-
缺失数据可能会引发异常,如果不妥善地处理,还可能导致程序崩溃。
--snip-- # 从文件中获取日期、最高气温和最低气温 filename = 'death_valley_2014.csv' with open(filename) as f: --snip---
运行这个程序时,出现一个错误:
C:\Users\lh9\PycharmProjects\untitled1\venv\Scripts\python.exe C:/Users/lh9/PycharmProjects/request/my_test01.py Traceback (most recent call last): File "C:/Users/lh9/PycharmProjects/request/my_test01.py", line 1457, in <module> high = int(row[1]) ValueError: invalid literal for int() with base 10: '' Process finished with exit code 1- 该traceback指出,Python无法处理其中一天的最高气温,因为它无法将空字符串(’ ’ )转换为整数。
-
-
再此修改:
dates, highs, lows = [], [], []

    for row in reader:
        try:
            current_date = datetime.strptime(row[0], '%Y-%m-%d')

            high = int(row[1])
            low = int(row[3])
        except ValueError:
            print(current_date, 'missing data')
        else:
            dates.append(current_date)
            highs.append(high)
            lows.append(low)
2、JSON格式:
- Pygal提供了一个适合初学者使用的地图创建工具,你将使用它来对人口数据进行可视化,以探索全球人口的分布情况。
2.1、下载世界人口数据:
- (http://data.okfn.org/ )提供了大量可以免费使用的数据集,这些数据就来自其中一个数据集。
2.2、提取相关的数据:
-
这个文件实际上就是一个很长的Python列表,其中每个元素都是一个包含四个键的字典:国家名、国别码、年份以及表示人口数量的值。我们只关心每个国家2010年的人口数量,因此我们首先编写一个打印这些信息的程序:
import json # 将数据加载到一个列表中 filename = 'population_data.json' with open(filename) as f: pop_data = json.load(f) for pop_dict in pop_data: if pop_dict['Year'] == '2010': country_name = pop_dict['Country Name'] population = pop_dict['Value'] print(country_name + ": " + population)-
我们首先导入了模块json ,以便能够正确地加载文件中的数据,然后,我们将数据存储在pop_data 中
-
函数json.load() 将数据转换为Python能够处理的格式,这里是一个列表。
rab World: 357868000
Caribbean small states: 6880000
East Asia & Pacific (all income levels): 2201536674
--snip--
Zimbabwe: 12571000
-
2.3、将字符串转换为数字值:
-
为处理这些人口数据,我们需要将表示人口数量的字符串转换为数字值,为此我们使用函数int():
-
我们先将字符串转换为浮点数,再将浮点数转换为整数:
import json # 将数据加载到一个列表中 filename = 'population_data.json' with open(filename) as f: pop_data = json.load(f) for pop_dict in pop_data: if pop_dict['Year'] == '2010': country_name = pop_dict['Country Name'] population = int(float(pop_dict['Value'])) print(country_name + ": " + str(population))- 函数float() 将字符串转换为小数,而函数int() 丢弃小数部分,返回一个整数
Arab World: 357868000
Caribbean small states: 6880000
East Asia & Pacific (all income levels): 2201536674
--snip--
Zimbabwe: 12571000
2.4、获取两个字母的国别码
-
首先安装
pip install pygal_maps_world -
再代码文件中添加
from pygal_maps_world.i18n import COUNTRIESfrom pygal_maps_world.i18n import COUNTRIES def get_country_code(country_name): """根据指定的国家, 返回pygal使用的两个字母的国别码""" for code, name in COUNTRIES.items(): if name == country_name: return code # 如果没有找到指定的国家, 就返回None return None print(get_country_code('Andorra')) print(get_country_code('United Arab Emirates')) print(get_country_code('Afghanistan'))-
get_country_code() 接受国家名,并将其存储在形参country_name 中,我们遍历COUNTRIES 中的国家名—国别码对
-
如果找到指定的国家名,就返回相应的国别码,在循环后面,我们在没有找到指定的国家名时返回None
ad ae af -
完善这个获取两个字母的国别码:
import json

from pygal_maps_world.i18n import COUNTRIES


def get_country_code(country_name):
    """根据指定的国家, 返回pygal使用的两个字母的国别码"""

    for code, name in COUNTRIES.items():
        if name == country_name:
            return code

    # 如果没有找到指定的国家, 就返回None
    return None

# 将数据加载到一个列表中
filename = 'population_data.json'

with open(filename) as f:
    pop_data = json.load(f)

for pop_dict in pop_data:
    if pop_dict['Year'] == '2010':
        country_name = pop_dict['Country Name']
        population = int(float(pop_dict['Value']))
        code = get_country_code(country_name)

        if code:
            print(code + ": " + str(population))

        else:
            print(country_name + ": " + str(population))
-
2.5、制作世界地图:
-
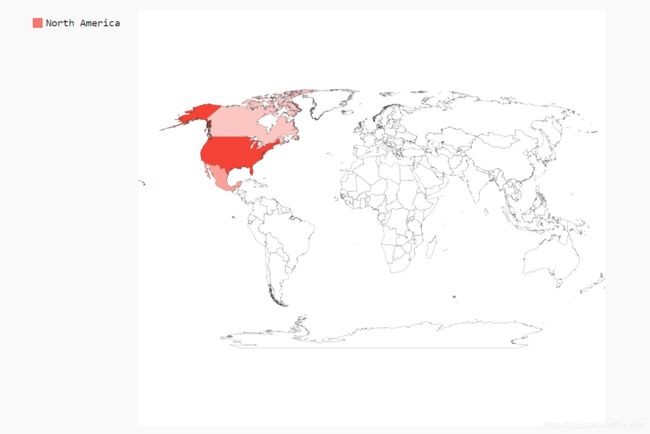
有了国别码后,制作世界地图易如反掌。
Pygal提供了图表类型Worldmap ,可帮助你制作呈现各国数据的世界地图import pygal_maps_world.maps wm = pygal_maps_world.maps.World() wm._title = 'North, Central, and South America' wm.add('North America', ['ca', 'mx', 'us']) wm.add('Central America', ['bz', 'cr', 'gt', 'hn', 'ni', 'pa', 'sv']) wm.add('South America', ['ar', 'bo', 'br', 'cl', 'co', 'ec', 'gf', 'gy', 'pe', 'py', 'sr', 'uy', 've']) wm.render_to_file('americas.svg')
2.6、再世界地图上呈现数字数据:
-
为练习在地图上呈现数字数据,我们来创建一幅地图,显示三个北美国家的人口数量:
import pygal_maps_world.maps

wm = pygal_maps_world.maps.World()
wm._title = 'Populations of Countries in North America'
wm.add('North America', {'ca': 34126000, 'us': 309349000, 'mx': 113423000})
wm.render_to_file('na_populations.svg')
2.7、绘制完整的世界人口地图:
-
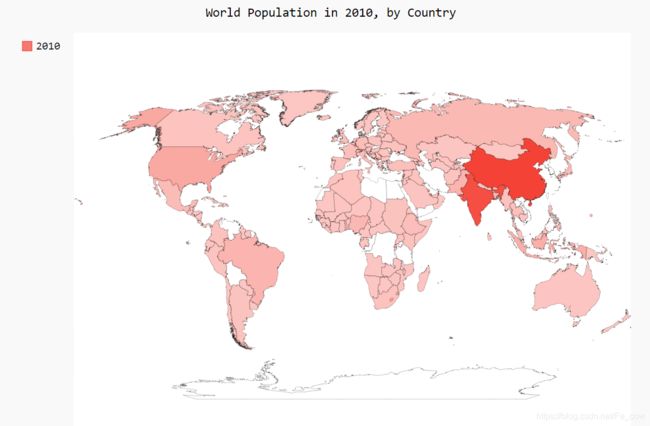
要呈现其他国家的人口数量,需要将前面处理的数据转换为Pygal要求的字典格式:键为两个字母的国别码,值为人口数量
from pygal_maps_world.i18n import COUNTRIES


def get_country_code(country_name):
    """根据指定的国家, 返回pygal使用的两个字母的国别码"""

    for code, name in COUNTRIES.items():
        if name == country_name:
            return code

    # 如果没有找到指定的国家, 就返回None
    return None


import json
import pygal_maps_world.maps

# 将数据加载到一个列表中
filename = 'population_data.json'

with open(filename) as f:
    pop_data = json.load(f)

# 创建一个包含人口数量的字典
cc_populations = {}
for pop_dict in pop_data:
    if pop_dict['Year'] == '2010':
        country = pop_dict['Country Name']
        population = int(float(pop_dict['Value']))

        code = get_country_code(country)
        if code:
            cc_populations[code] = population

wm = pygal_maps_world.maps.World()
wm.title = 'World Population in 2010, by Country'

wm.add('2010', cc_populations)
wm.render_to_file('world_population.svg')
2.8、根据人口数量将国家分组:
-
印度和中国的人口比其他国家多得多,但在当前的地图中,它们的颜色与其他国家差别较小。中国和印度的人口都超过了10亿,接下来人口最多的国家是美国,但只有大约3亿。
-
下面不将所有国家都作为一个编组,而是根据人口数量分成三组——少于1000万的、介于1000万和10亿之间的以及超过10亿
from pygal_maps_world.i18n import COUNTRIES


def get_country_code(country_name):
    """根据指定的国家, 返回pygal使用的两个字母的国别码"""

    for code, name in COUNTRIES.items():
        if name == country_name:
            return code

    # 如果没有找到指定的国家, 就返回None
    return None


import json
import pygal_maps_world.maps

# 将数据加载到一个列表中
filename = 'population_data.json'

with open(filename) as f:
    pop_data = json.load(f)

# 创建一个包含人口数量的字典
cc_populations = {}
for pop_dict in pop_data:
    if pop_dict['Year'] == '2010':
        country = pop_dict['Country Name']
        population = int(float(pop_dict['Value']))

        code = get_country_code(country)
        if code:
            cc_populations[code] = population

# 根据人口数量将所有的国家分成三组:
cc_pops_1, cc_pops_2, cc_pops_3 = {}, {}, {}
for cc, pop, in cc_populations.items():
    if pop < 10000000:
        cc_pops_1[cc] = pop
    elif pop < 1000000000:
        cc_pops_2[cc] = pop
    else:
        cc_pops_3[cc] = pop

# 看看每组分别包含了多少个国家
print(len(cc_pops_1), len(cc_pops_2), len(cc_pops_3))


wm = pygal_maps_world.maps.World()
wm.title = 'World Population in 2010, by Country'

wm.add('0-10m', cc_pops_1)
wm.add('10m-1bn', cc_pops_2)
wm.add('>1bn', cc_pops_3)

wm.render_to_file('world_population.svg')
2.9、使用Pygal设置世界地图的样式:
-
在这个地图中,根据人口将国家分组虽然很有效,但默认的颜色设置很难看
-
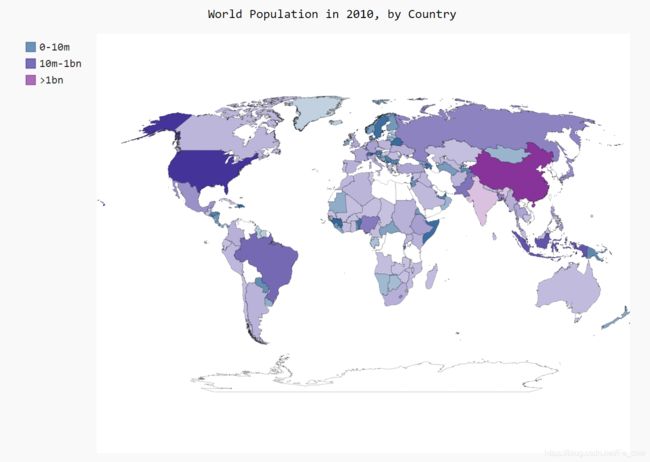
下面使用Pygal样式设置指令来调整颜色。我们也让Pygal使用一种基色,但将指定该基色,并让三个分组的颜色差别更大:
import json import pygal from pygal.style import RotateStyle --snip-- # 根据人口数量将所有的国家分成三组 cc_pops_1, cc_pops_2, cc_pops_3 = {}, {}, {} for cc, pop in cc_populations.items(): if pop < 10000000: --snip-- wm_style = RotateStyle('#336699') wm = pygal.Worldmap(style=wm_style) wm.title = 'World Population in 2010, by Country' --snip---
Pygal样式存储在模块style 中,我们从这个模块中导入了样式RotateStyle -
创建这个类的实例时,需要提供
一个实参——十六进制的RGB颜色 -
Pygal将根据指定的颜色为每组选择颜色。十六进制格式 的RGB颜色是一个以井号(#)打头的字符串
后面跟着6个字符,其中前两个字符表示红色分量,接下来的两个表示绿色分量,最后两个表示蓝色分量。 -
每个分量的取值范围为00 (没有相应的颜色)~FF (包含最多的相应颜色)。如果你在线搜索hex color chooser(十六进制颜色选择器 ),可找到让你能够尝试选择不同的颜色并显示其RGB值的工具。这里使用的颜色值(#336699)混合了少量的红色(33)、多一些的绿色(66)和更多一些的蓝色(99),它为RotateStyle 提供了一种淡蓝色基色。
-
RotateStyle 返回一个样式对象,我们将其存储在wm_style 中。为使用这个样式对象,我们在创建World() 实例时以关键字实参的方式传递它
-
2.10、加亮颜色主题:
-
Pygal通常默认使用较暗的颜色主题。 -
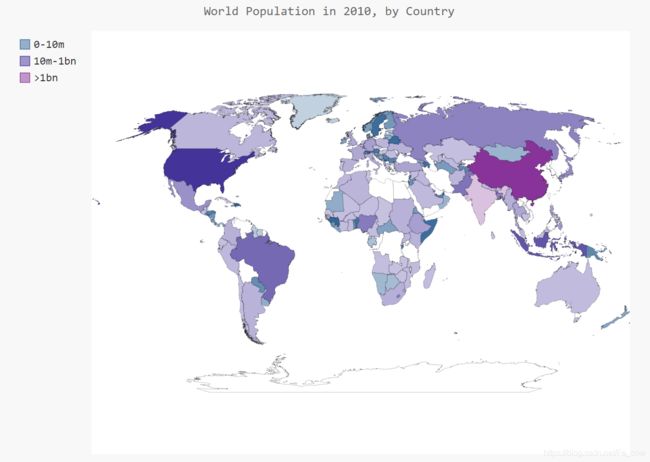
为方便印刷,我使用
LightColorizedStyle 加亮了地图的颜色。 -
这个类修改整个图表的主题,包括背景色、标签以及各个国家的颜色。要使用这个样式,先导入它:
from pygal_maps_world.i18n import COUNTRIES


def get_country_code(country_name):
    """根据指定的国家, 返回pygal使用的两个字母的国别码"""

    for code, name in COUNTRIES.items():
        if name == country_name:
            return code

    # 如果没有找到指定的国家, 就返回None
    return None


import json
import pygal_maps_world.maps
from pygal.style import LightColorizedStyle, RotateStyle

# 将数据加载到一个列表中
filename = 'population_data.json'

with open(filename) as f:
    pop_data = json.load(f)

# 创建一个包含人口数量的字典
cc_populations = {}
for pop_dict in pop_data:
    if pop_dict['Year'] == '2010':
        country = pop_dict['Country Name']
        population = int(float(pop_dict['Value']))

        code = get_country_code(country)
        if code:
            cc_populations[code] = population

cc_pops_1, cc_pops_2, cc_pops_3 = {}, {}, {}

for cc, pop in cc_populations.items():
    if pop < 10000000:
        cc_pops_1[cc] = pop
    elif pop < 1000000000:
        cc_pops_2[cc] = pop
    else:
        cc_pops_3[cc] = pop

wm_style = RotateStyle('#336699', base_style=LightColorizedStyle)
wm = pygal_maps_world.maps.World(style=wm_style)
wm.title = 'World Population in 2010, by Country'

wm.add('0-10m', cc_pops_1)
wm.add('10m-1bn', cc_pops_2)
wm.add('>1bn', cc_pops_3)

wm.render_to_file('world_population.svg')
