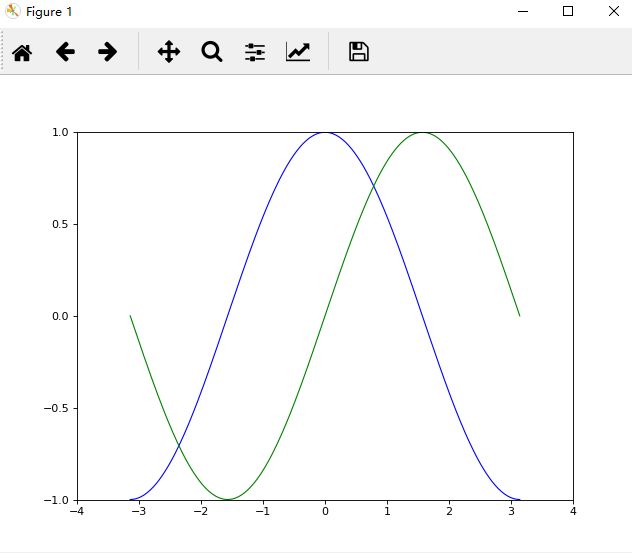
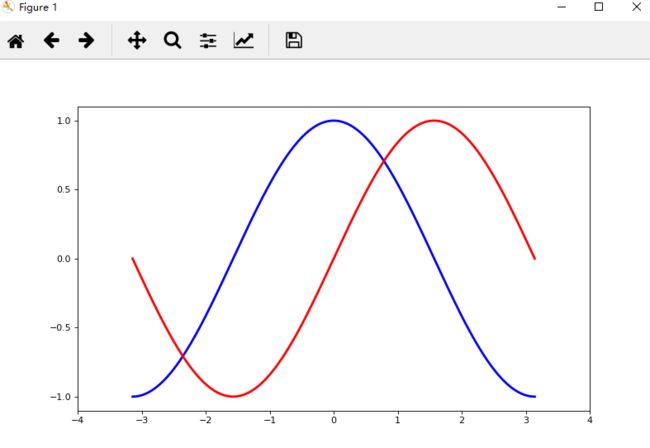
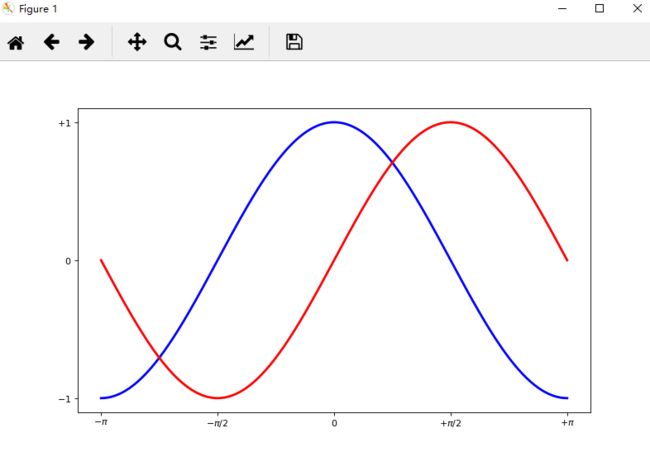
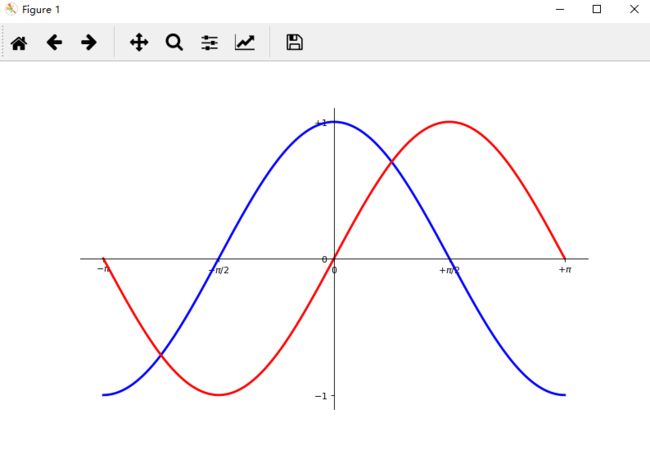
从画一个最简单的正余弦函数sin、cos开始,逐步增加复杂性。
代码后边的图便是代码的运行结果。
# 20181221 By Galory
# learning materials from http://www.labri.fr/perso/nrougier/teaching/matplotlib/
# draw the cosine and sine functions on the same plot

# using defaults
import numpy as np
import matplotlib.pyplot as plt
# get the data for the sine and cosine functions
X = np.linspace(-np.pi,np.pi,256,endpoint=True)
# X is now a numpy array with 256 values
# ranging from -π to +π (included).
# C is the cosine (256 values) and S is the sine (256 values)
C,S = np.cos(X),np.sin(X)
plt.plot(X,C)
plt.plot(X,S)
plt.show()
# Instantiating defaults
# Imports
import numpy as np
import matplotlib.pyplot as plt

# Create a new figure of size 8x6 points,using 100 dots perinch
plt.figure(figsize=(8,6),dpi=80)

# Create a new subplot from a grid of 1x1
plt.subplot(111)

X = np.linspace(-np.pi,np.pi,256,endpoint=True)
C,S = np.cos(X),np.sin(X)

# Plot cosine using blue color with a continuous line of width 1(pixels)
plt.plot(X,C,color = "blue",linewidth = 1.0,linestyle = "-")

# Plot sine using green color with a continuous line of width 1(pixels)
plt.plot(X,S,color = "green",linewidth = 1.0,linestyle = "-")

# Set x limits
plt.xlim(-4.0,4.0)

# Set x ticks
plt.xticks(np.linspace(-4,4,9,endpoint=True))

# Set y limits
plt.ylim(-1.0,1.0)

# Set y ticks
plt.yticks(np.linspace(-1,1,5,endpoint=True))

# Save figure using 72 dots per inch
# savefig("../figures/exercice_2.png",dpi=72)

# Show result on screen
plt.show()
# Changing colors andline widths
# Imports
import numpy as np
import matplotlib.pyplot as plt

# Create a new figure of size 8x6 points,using 100 dots perinch
plt.figure(figsize=(10,6),dpi=80)

# Create a new subplot from a grid of 1x1
plt.subplot(111)

X = np.linspace(-np.pi,np.pi,256,endpoint=True)
C,S = np.cos(X),np.sin(X)

# Plot cosine using blue color with a continuous line of width 1(pixels)
plt.plot(X,C,color = "blue",linewidth = 2.5,linestyle = "-")

# Plot sine using green color with a continuous line of width 1(pixels)
plt.plot(X,S,color = "red",linewidth = 2.5,linestyle = "-")

# Set x limits
plt.xlim(-4.0,4.0)

# Set x ticks
plt.xticks(np.linspace(-4,4,9,endpoint=True))

# Set y limits
plt.ylim(-1.0,1.0)

# Set y ticks
plt.yticks(np.linspace(-1,1,5,endpoint=True))

# Save figure using 72 dots per inch
# savefig("../figures/exercice_2.png",dpi=72)

# Show result on screen
plt.show()
import numpy as np
import matplotlib.pyplot as plt
plt.figure(figsize=(10,6),dpi=80)
plt.subplot(111)
X = np.linspace(-np.pi,np.pi,256,endpoint=True)
C,S = np.cos(X),np.sin(X)
plt.plot(X,C,color = "blue",linewidth = 2.5,linestyle = "-")
plt.plot(X,S,color = "red",linewidth = 2.5,linestyle = "-")
plt.xlim(X.min()*1.1,X.max()*1.1)
plt.xticks(np.linspace(-4,4,9,endpoint=True))
plt.ylim(C.min()*1.1,C.max()*1.1)
plt.yticks(np.linspace(-1,1,5,endpoint=True))
plt.show()
# Setting ticks
import numpy as np
import matplotlib.pyplot as plt
plt.figure(figsize=(10,6),dpi=80)
plt.subplot(111)
X = np.linspace(-np.pi,np.pi,256,endpoint=True)
C,S = np.cos(X),np.sin(X)
plt.plot(X,C,color = "blue",linewidth = 2.5,linestyle = "-")
plt.plot(X,S,color = "red",linewidth = 2.5,linestyle = "-")
plt.xlim(X.min()*1.1,X.max()*1.1)
plt.xticks([-np.pi,-np.pi/2,0,np.pi/2,np.pi])
plt.ylim(C.min()*1.1,C.max()*1.1)
plt.yticks([-1,0,1])
plt.show()
# Setting tick labels
# Ticks are now properly placed but their label is not very explicit. We could guess that 3.142 is π but it would be better to make it explicit. When we set tick values, we can also provide a corresponding label in the second argument list. Note that we'll use latex to allow for nice rendering of the label.
import numpy as np
import matplotlib.pyplot as plt
plt.figure(figsize=(10,6),dpi=80)
plt.subplot(111)
X = np.linspace(-np.pi,np.pi,256,endpoint=True)
C,S = np.cos(X),np.sin(X)
plt.plot(X,C,color = "blue",linewidth = 2.5,linestyle = "-")
plt.plot(X,S,color = "red",linewidth = 2.5,linestyle = "-")
plt.xlim(X.min()*1.1,X.max()*1.1)
plt.xticks([-np.pi,-np.pi/2,0,np.pi/2,np.pi],[r'$-\pi$',r'$-\pi/2$',r'$0$',r'$+\pi/2$',r'$+\pi$'])
plt.ylim(C.min()*1.1,C.max()*1.1)
plt.yticks([-1,0,1],[r'$-1$',r'$0$',r'$+1$'])
plt.show()
# Moving spines
# Spines are the lines connecting the axis tick marks and noting the boundaries of the data area. They can be placed at arbitrary positions and until now, they were on the border of the axis. We'll change that since we want to have them in the middle. Since there are four of them (top/bottom/left/right), we'll discard the top and right by setting their color to none and we'll move the bottom and left ones to coordinate 0 in data space coordinates.
import numpy as np
import matplotlib.pyplot as plt
plt.figure(figsize=(10,6),dpi=80)
plt.subplot(111)
X = np.linspace(-np.pi,np.pi,256,endpoint=True)
C,S = np.cos(X),np.sin(X)
plt.plot(X,C,color = "blue",linewidth = 2.5,linestyle = "-")
plt.plot(X,S,color = "red",linewidth = 2.5,linestyle = "-")
plt.xlim(X.min()*1.1,X.max()*1.1)
plt.xticks([-np.pi,-np.pi/2,0,np.pi/2,np.pi],[r'$-\pi$',r'$-\pi/2$',r'$0$',r'$+\pi/2$',r'$+\pi$'])
plt.ylim(C.min()*1.1,C.max()*1.1)
plt.yticks([-1,0,1],[r'$-1$',r'$0$',r'$+1$'])
ax = plt.gca()
ax.spines['right'].set_color('none')
ax.spines['top'].set_color('none')
ax.xaxis.set_ticks_position('bottom')
ax.spines['bottom'].set_position(('data',0))
ax.yaxis.set_ticks_position('left')
ax.spines['left'].set_position(('data',0))
plt.show()
# Adding a legend
# Let's add a legend in the upper left corner. This only requires adding the keyword argument label (that will be used in the legend box) to the plot commands.
import numpy as np
import matplotlib.pyplot as plt
plt.figure(figsize=(10,6),dpi=80)
plt.subplot(111)
X = np.linspace(-np.pi,np.pi,256,endpoint=True)
C,S = np.cos(X),np.sin(X)
plt.plot(X,C,color = "blue",linewidth = 2.5,linestyle = "-",label="cosine")
plt.plot(X,S,color = "red",linewidth = 2.5,linestyle = "-",label="sine")
plt.xlim(X.min()*1.1,X.max()*1.1)
plt.xticks([-np.pi,-np.pi/2,0,np.pi/2,np.pi],[r'$-\pi$',r'$-\pi/2$',r'$0$',r'$+\pi/2$',r'$+\pi$'])
plt.ylim(C.min()*1.1,C.max()*1.1)
plt.yticks([-1,0,1],[r'$-1$',r'$0$',r'$+1$'])
ax = plt.gca()
ax.spines['right'].set_color('none')
ax.spines['top'].set_color('none')
ax.xaxis.set_ticks_position('bottom')
ax.spines['bottom'].set_position(('data',0))
ax.yaxis.set_ticks_position('left')
ax.spines['left'].set_position(('data',0))
plt.legend(loc='upper left',frameon=False)
plt.show()
# Annotate some points 注释一些点
# Let's annotate some interesting points using the annotate command. We chose the 2π/3 value and we want to annotate both the sine and the cosine. We'll first draw a marker on the curve as well as a straight dotted line. Then, we'll use the annotate command to display some text with an arrow.
import numpy as np
import matplotlib.pyplot as plt
plt.figure(figsize=(10,6),dpi=80)
plt.subplot(111)
X = np.linspace(-np.pi,np.pi,256,endpoint=True)
C,S = np.cos(X),np.sin(X)
plt.plot(X,C,color = "blue",linewidth = 2.5,linestyle = "-",label="cosine")
plt.plot(X,S,color = "red",linewidth = 2.5,linestyle = "-",label="sine")
plt.xlim(X.min()*1.1,X.max()*1.1)
plt.xticks([-np.pi,-np.pi/2,0,np.pi/2,np.pi],[r'$-\pi$',r'$-\pi/2$',r'$0$',r'$+\pi/2$',r'$+\pi$'])
plt.ylim(C.min()*1.1,C.max()*1.1)
plt.yticks([-1,0,1],[r'$-1$',r'$0$',r'$+1$'])
ax = plt.gca()
ax.spines['right'].set_color('none')
ax.spines['top'].set_color('none')
ax.xaxis.set_ticks_position('bottom')
ax.spines['bottom'].set_position(('data',0))
ax.yaxis.set_ticks_position('left')
ax.spines['left'].set_position(('data',0))
plt.legend(loc='upper left',frameon=False)

t = 2*np.pi/3
plt.plot([t,t],[0,np.cos(t)],color='blue',linewidth=1.5,linestyle="-")
plt.scatter([t,],[np.cos(t),],50,color = 'blue')
plt.annotate(r'$\sin(\frac{2\pi}{3})=\frac{\sqrt{3}}{2}$',
             xy=(t, np.sin(t)), xycoords='data',
             xytext=(+10, +30), textcoords='offset points', fontsize=16,
             arrowprops=dict(arrowstyle="->", connectionstyle="arc3,rad=.2"))

plt.plot([t,t],[0,np.sin(t)], color ='red', linewidth=1.5, linestyle="--")
plt.scatter([t,],[np.sin(t),], 50, color ='red')

plt.annotate(r'$\cos(\frac{2\pi}{3})=-\frac{1}{2}$',
             xy=(t, np.cos(t)), xycoords='data',
             xytext=(-90, -50), textcoords='offset points', fontsize=16,
             arrowprops=dict(arrowstyle="->", connectionstyle="arc3,rad=.2"))
plt.show()
# Devils is in the details
# The tick labels are now hardly visible because of the blue and red lines. We can make them bigger and we can also adjust their properties such that they'll be rendered on a semi-transparent white background. This will allow us to see both the data and the labels.
import numpy as np
import matplotlib.pyplot as plt
plt.figure(figsize=(10,6),dpi=80)
plt.subplot(111)
X = np.linspace(-np.pi,np.pi,256,endpoint=True)
C,S = np.cos(X),np.sin(X)
plt.plot(X,C,color = "blue",linewidth = 2.5,linestyle = "-",label="cosine")
plt.plot(X,S,color = "red",linewidth = 2.5,linestyle = "-",label="sine")
plt.xlim(X.min()*1.1,X.max()*1.1)
plt.xticks([-np.pi,-np.pi/2,0,np.pi/2,np.pi],[r'$-\pi$',r'$-\pi/2$',r'$0$',r'$+\pi/2$',r'$+\pi$'])
plt.ylim(C.min()*1.1,C.max()*1.1)
plt.yticks([-1,0,1],[r'$-1$',r'$0$',r'$+1$'])
ax = plt.gca()
ax.spines['right'].set_color('none')
ax.spines['top'].set_color('none')
ax.xaxis.set_ticks_position('bottom')
ax.spines['bottom'].set_position(('data',0))
ax.yaxis.set_ticks_position('left')
ax.spines['left'].set_position(('data',0))
plt.legend(loc='upper left',frameon=False)

t = 2*np.pi/3
plt.plot([t,t],[0,np.cos(t)],color='blue',linewidth=1.5,linestyle="-")
plt.scatter([t,],[np.cos(t),],50,color = 'blue')
plt.annotate(r'$\sin(\frac{2\pi}{3})=\frac{\sqrt{3}}{2}$',
             xy=(t, np.sin(t)), xycoords='data',
             xytext=(+10, +30), textcoords='offset points', fontsize=16,
             arrowprops=dict(arrowstyle="->", connectionstyle="arc3,rad=.2"))

plt.plot([t,t],[0,np.sin(t)], color ='red', linewidth=1.5, linestyle="--")
plt.scatter([t,],[np.sin(t),], 50, color ='red')

plt.annotate(r'$\cos(\frac{2\pi}{3})=-\frac{1}{2}$',
             xy=(t, np.cos(t)), xycoords='data',
             xytext=(-90, -50), textcoords='offset points', fontsize=16,
             arrowprops=dict(arrowstyle="->", connectionstyle="arc3,rad=.2"))
for label in ax.get_xticklabels() + ax.get_yticklabels():
    label.set_fontsize(16)
    label.set_bbox(dict(facecolor='white',edgecolor='None',alpha=0.65))
plt.show()
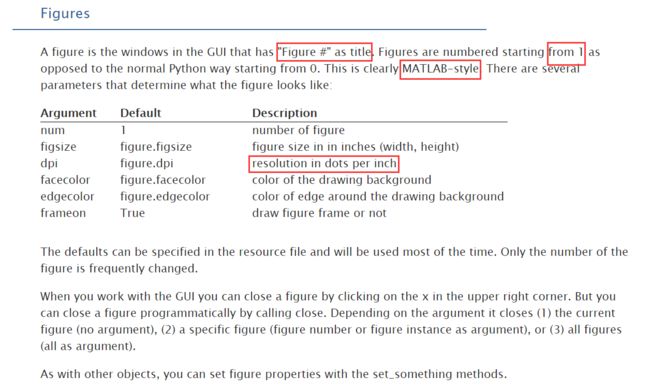
Subplots:
With subplot you can arrange plots in a regular grid. You need to specify the number of rows and columns and the number of the plot. Note that the gridspec command is a more powerful alternative.
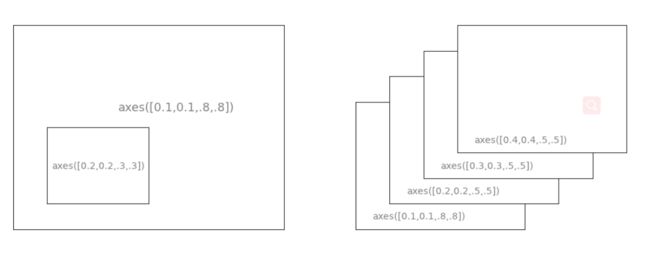
Axes:
Axes are very similar to subplots but allow placement of plots at any location in the figure. So if we want to put a smaller plot inside a bigger one we do so with axes.
'''
Animation
'''
Animation
Drip drop
import matplotlib.pyplot as plt
import numpy as np
from matplotlib.animation import FuncAnimation
New figure with background
fig = plt.figure(figsize=(6,6),facecolor='white')
New axis over the whole figure,no frame and a 1:1 aspect ratio
ax = fig.add_axes([0,0,1,1],frameon = False,aspect = 1)
Number of ring
n = 50
size_min = 50
size_max = 50*50
Ring position
P = np.random.uniform(0,1,(n,2))
Ring colors
C = np.ones((n,4)) * (0,0,0,1)
Alpha color channel goes from 0 (transparent) to 1 (opaque)
C[:,3] = np.linspace(0,1,n)
Ring sizes
S = np.linspace(size_min,size_max,n)
Scatter plot
scat = ax.scatter(P[:,0],P[:,1],s=S,lw=0.5,edgecolors = C,facecolors = 'None')
Ensure limits are [0,1] and remove ticks
ax.set_xlim(0,1),ax.set_xticks([])
ax.set_ylim(0,1),ax.set_yticks([])
plt.show()
'''
# Animation
# Drip drop
import matplotlib.pyplot as plt
import numpy as np
from matplotlib.animation import FuncAnimation
# New figure with background
fig = plt.figure(figsize=(6,6),facecolor='white')
# New axis over the whole figure,no frame and a 1:1 aspect ratio
ax = fig.add_axes([0,0,1,1],frameon = False,aspect = 1)

# Number of ring
n = 50
size_min = 50
size_max = 50*50

# Ring position
P = np.random.uniform(0,1,(n,2))
# Ring colors
C = np.ones((n,4)) * (0,0,0,1)
# Alpha color channel goes from 0 (transparent) to 1 (opaque)
C[:,3] = np.linspace(0,1,n)
# Ring sizes
S = np.linspace(size_min,size_max,n)
# Scatter plot
scat = ax.scatter(P[:,0],P[:,1],s=S,lw=0.5,edgecolors = C,facecolors = 'None')
# Ensure limits are [0,1] and remove ticks
ax.set_xlim(0,1),ax.set_xticks([])
ax.set_ylim(0,1),ax.set_yticks([])


# update function for our animation
def update(frame):
    global P, C, S

    # Every ring is made more transparent
    C[:,3] = np.maximum(0, C[:,3] - 1.0/n)

    # Each ring is made larger
    S += (size_max - size_min) / n

    # Reset ring specific ring (relative to frame number)
    i = frame % 50
    P[i] = np.random.uniform(0,1,2)
    S[i] = size_min
    C[i,3] = 1

    # Update scatter object
    scat.set_edgecolors(C)
    scat.set_sizes(S)
    scat.set_offsets(P)

    # Return the modified object
    return scat,
animation = FuncAnimation(fig,update,interval=10,blit=True,frames=200)
# animation.save('rain.gif',writer='imagemagick',fps=30,dpi=40)
plt.show()
此时就有了动画效果,这里没有显示。
# Bar Plots
import numpy as np
import matplotlib.pyplot as plt

n = 12
X = np.arange(n)
Y1 = (1-X/float(n)) * np.random.uniform(0.5,1.0,n)
Y2 = (1-X/float(n)) * np.random.uniform(0.5,1.0,n)

# plt.axes([0.025,0.025,0.95,0.95])
plt.bar(X, +Y1, facecolor='#9999ff', edgecolor='white')
plt.bar(X, -Y2, facecolor='#ff9999', edgecolor='white')

for x,y in zip(X,Y1):
    plt.text(x, y+0.05, '%.2f' % y, ha='center', va= 'bottom')

for x,y in zip(X,Y2):
    plt.text(x, -y-0.05, '%.2f' % y, ha='center', va= 'top')

plt.xlim(-.5,n), plt.xticks([])
plt.ylim(-1.25,+1.25), plt.yticks([])

# savefig('../figures/bar_ex.png', dpi=48)
plt.show()
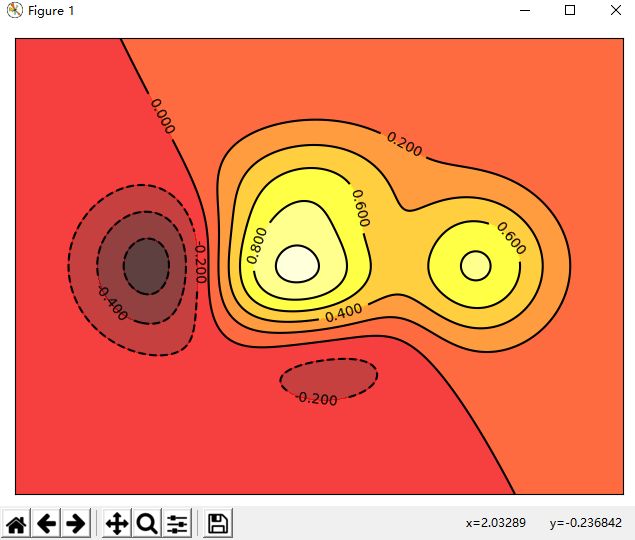
# Contour Plots
import numpy as np
import matplotlib.pyplot as plt

def f(x,y):
    return (1-x/2+x**5+y**3)*np.exp(-x**2-y**2)

n = 256
x = np.linspace(-3,3,n)
y = np.linspace(-3,3,n)
X,Y = np.meshgrid(x,y)

plt.axes([0.025,0.025,0.95,0.95])
plt.contourf(X, Y, f(X,Y), 8, alpha=.75, cmap=plt.cm.hot)
C = plt.contour(X, Y, f(X,Y), 8, colors='black', linewidth=.5)
plt.clabel(C,inline=1,fontsize=10)
plt.xticks([]),plt.yticks([])
# savefig('../figures/contour_ex.png',dpi=48)
plt.show()
# Imshow
import numpy as np
import matplotlib.pyplot as plt

def f(x,y): return (1-x/2+x**5+y**3)*np.exp(-x**2-y**2)

n = 10
x = np.linspace(-3,3,4*n)
y = np.linspace(-3,3,3*n)
X,Y = np.meshgrid(x,y)
Z = f(X,Y)
plt.axes([0.025,0.025,0.95,0.95])
plt.imshow(Z,interpolation='nearest',cmap='bone',origin='lower')
plt.colorbar(shrink=.92)

plt.xticks([]),plt.yticks([])
# savefig('../figures/imshow_ex.png', dpi=48)
plt.show()
# Pie Charts
import numpy as np
import matplotlib.pyplot as plt
n= 20
Z = np.ones(n)
Z[-1]*=2
plt.axes([0.025,0.025,0.95,0.95])
plt.pie(Z,explode=Z*.05,colors = ['%f' %(i/float(n)) for i in range(n)])
plt.gca().set_aspect('equal')
plt.xticks([]),plt.yticks([])
# savefig('../figures/pie_ex.png',dpi=48)
plt.show()
import numpy as np
import matplotlib.pyplot as plt

n = 8
X,Y = np.mgrid[0:n,0:n]
T = np.arctan2(Y-n/2.0, X-n/2.0)
R = 10+np.sqrt((Y-n/2.0)**2+(X-n/2.0)**2)
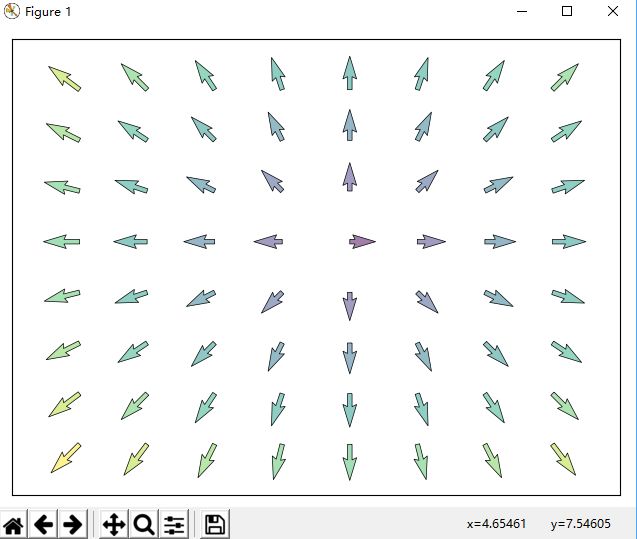
U,V = R*np.cos(T), R*np.sin(T)

plt.axes([0.025,0.025,0.95,0.95])
plt.quiver(X,Y,U,V,R, alpha=.5)
plt.quiver(X,Y,U,V, edgecolor='k', facecolor='None', linewidth=.5)

plt.xlim(-1,n), plt.xticks([])
plt.ylim(-1,n), plt.yticks([])

# savefig('../figures/quiver_ex.png',dpi=48)
plt.show()
# Grids
import numpy as np
import matplotlib.pyplot as plt

ax = plt.axes([0.025,0.025,0.95,0.95])

ax.set_xlim(0,4)
ax.set_ylim(0,3)
ax.xaxis.set_major_locator(plt.MultipleLocator(1.0))
ax.xaxis.set_minor_locator(plt.MultipleLocator(0.1))
ax.yaxis.set_major_locator(plt.MultipleLocator(1.0))
ax.yaxis.set_minor_locator(plt.MultipleLocator(0.1))
ax.grid(which='major', axis='x', linewidth=0.75, linestyle='-', color='0.75')
ax.grid(which='minor', axis='x', linewidth=0.25, linestyle='-', color='0.75')
ax.grid(which='major', axis='y', linewidth=0.75, linestyle='-', color='0.75')
ax.grid(which='minor', axis='y', linewidth=0.25, linestyle='-', color='0.75')
ax.set_xticklabels([])
ax.set_yticklabels([])

# savefig('../figures/grid_ex.png',dpi=48)
plt.show()
# Multi Plots
import numpy as np
import matplotlib.pyplot as plt

fig = plt.figure()
fig.subplots_adjust(bottom=0.025, left=0.025, top = 0.975, right=0.975)

plt.subplot(2,1,1)
plt.xticks([]), plt.yticks([])

plt.subplot(2,3,4)
plt.xticks([]), plt.yticks([])

plt.subplot(2,3,5)
plt.xticks([]), plt.yticks([])

plt.subplot(2,3,6)
plt.xticks([]), plt.yticks([])

# plt.savefig('../figures/multiplot_ex.png',dpi=48)
plt.show()
# Polar Axis
import numpy as np
import matplotlib.pyplot as plt

ax = plt.axes([0.025,0.025,0.95,0.95], polar=True)

N = 20
theta = np.arange(0.0, 2*np.pi, 2*np.pi/N)
radii = 10*np.random.rand(N)
width = np.pi/4*np.random.rand(N)
bars = plt.bar(theta, radii, width=width, bottom=0.0)

for r,bar in zip(radii, bars):
    bar.set_facecolor( plt.cm.jet(r/10.))
    bar.set_alpha(0.5)

ax.set_xticklabels([])
ax.set_yticklabels([])
# savefig('../figures/polar_ex.png',dpi=48)
plt.show()
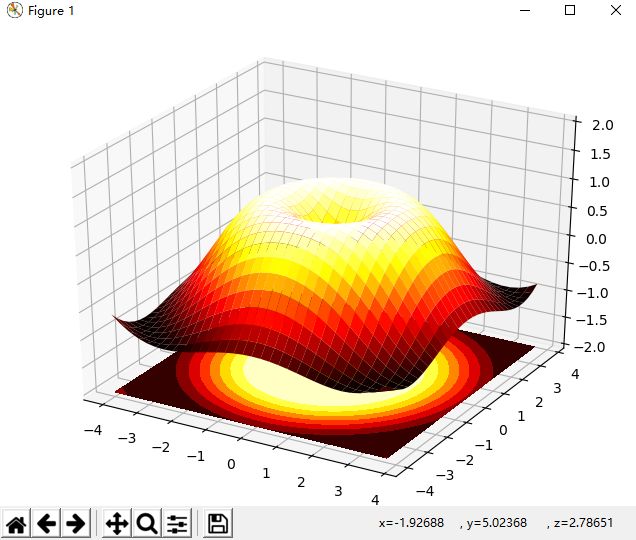
# 3D Plots
import numpy as np
import matplotlib.pyplot as plt
from mpl_toolkits.mplot3d import Axes3D

fig = plt.figure()
ax = Axes3D(fig)
X = np.arange(-4, 4, 0.25)
Y = np.arange(-4, 4, 0.25)
X, Y = np.meshgrid(X, Y)
R = np.sqrt(X**2 + Y**2)
Z = np.sin(R)

ax.plot_surface(X, Y, Z, rstride=1, cstride=1, cmap=plt.cm.hot)
ax.contourf(X, Y, Z, zdir='z', offset=-2, cmap=plt.cm.hot)
ax.set_zlim(-2,2)

# savefig('../figures/plot3d_ex.png',dpi=48)
plt.show()
# Text
import numpy as np
import matplotlib.pyplot as plt

eqs = []
eqs.append((r"$W^{3\beta}_{\delta_1 \rho_1 \sigma_2} = U^{3\beta}_{\delta_1 \rho_1} + \frac{1}{8 \pi 2} \int^{\alpha_2}_{\alpha_2} d \alpha^\prime_2 \left[\frac{ U^{2\beta}_{\delta_1 \rho_1} - \alpha^\prime_2U^{1\beta}_{\rho_1 \sigma_2} }{U^{0\beta}_{\rho_1 \sigma_2}}\right]$"))
eqs.append((r"$\frac{d\rho}{d t} + \rho \vec{v}\cdot\nabla\vec{v} = -\nabla p + \mu\nabla^2 \vec{v} + \rho \vec{g}$"))
eqs.append((r"$\int_{-\infty}^\infty e^{-x^2}dx=\sqrt{\pi}$"))
eqs.append((r"$E = mc^2 = \sqrt{{m_0}^2c^4 + p^2c^2}$"))
eqs.append((r"$F_G = G\frac{m_1m_2}{r^2}$"))


plt.axes([0.025,0.025,0.95,0.95])

for i in range(24):
    index = np.random.randint(0,len(eqs))
    eq = eqs[index]
    size = np.random.uniform(12,32)
    x,y = np.random.uniform(0,1,2)
    alpha = np.random.uniform(0.25,.75)
    plt.text(x, y, eq, ha='center', va='center', color="#11557c", alpha=alpha,
             transform=plt.gca().transAxes, fontsize=size, clip_on=True)

plt.xticks([]), plt.yticks([])
# savefig('../figures/text_ex.png',dpi=48)
plt.show()

