一篇文章读懂Unity内存 Understanding Memory on iOS
孙广东 2018.5.26
Understanding Memory on iOS
- What kind of memory?
• Physical/Resident Memory
• Graphics Memory
• Virtual Memory
• Malloc Heap
• Dirty Memory
• Native Memory
• Mono Heap
Physical Memory (RAM)
• The total amount of memory on-chip
• You can’t have more*
* But Android users can... until it is mysteriously goneVirtual Memory (VM)
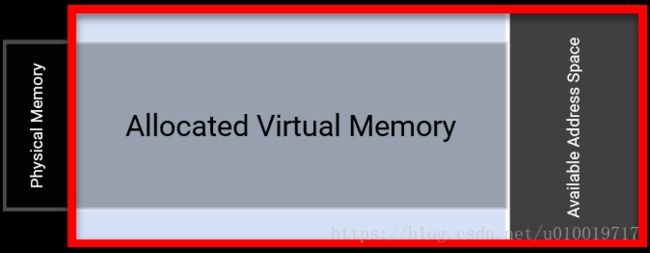
• iOS apps don’t work with Physical Memory directly, they work with Virtual Memory
• App’s private address space
• Divided into Pages (4KB or 16KB)
• Pages are mapped to Physical Memory by the OS
Resident Memory
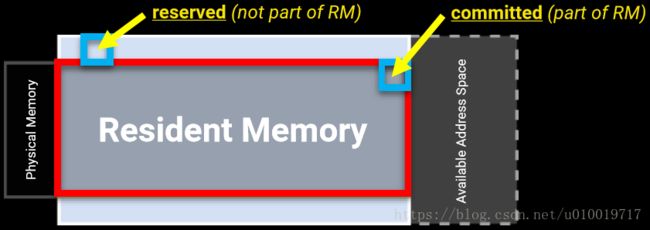
• An app can allocate a block of memory in Virtual Memory but not use it (”reserve”)
• The app has to modify the allocated VM for the OS to map it to PM (”commit”)
• Resident Memory is the total amount of Physical Memory used by the app at any moment
Clean Memory and Dirty Memory
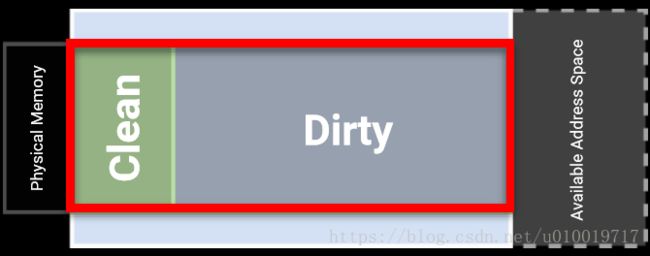
• Clean Memory — read-only pages of Resident Memory which iOS can remove and reload
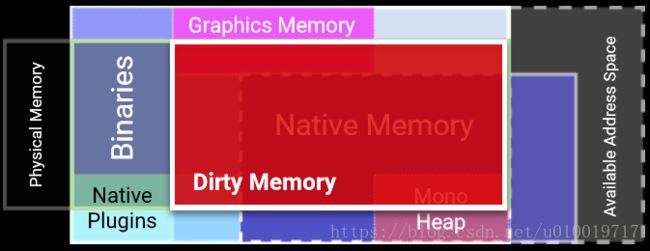
• Dirty Memory — everything else in Resident Memory
• Apps can share Clean Memory pages (like, system frameworks)
• Memory allocated for the following data is Clean (iOS can reload this from disk):
• App’s binaries, static code segments,
• memory-mapped files,
• System frameworks and dynamic libraries, etc.
Graphics Memory (VRAM)
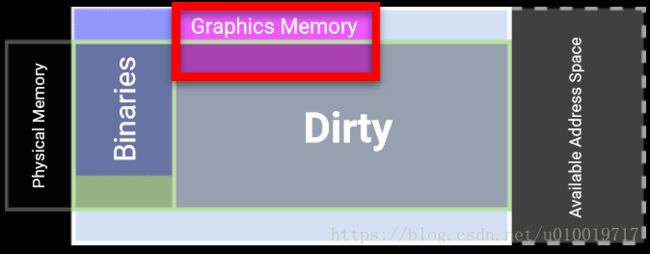
• iOS uses a Unified Memory Architecture — GPU and CPU share Physical Memory
• Graphics Driver allocates Virtual Memory for its resources
• Most of this is Resident and Dirty
Malloc Heap
• A region of VM where the app can allocate memory using malloc and calloc functions
• This is where Unity allocates all memory for its needs
• The maximum size is unknown, but seems to be 2x Physical Memory
Swapped (compressed) Memory
• iOS doesn’t have a page file and can’t dump rarely used Virtual Memory pages to disk
• But it can compress them and store in some other region of Physical Memory
• SCM is a compressed part of the app’s Dirty Memory
• The algorithm is unknown, but iOS usually tries to compress as much as it can
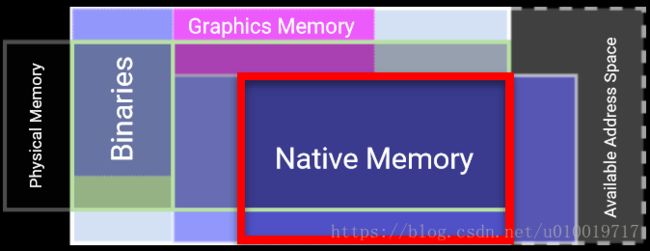
Native (Unity) Memory
• Unity is a C++ engine with a .NET Virtual Machine
• Native Memory — part of Malloc Heap (VM Region) used for all Unity’s allocations
• All asset data is in Native Memory, exposed to C# as lightweight wrappers
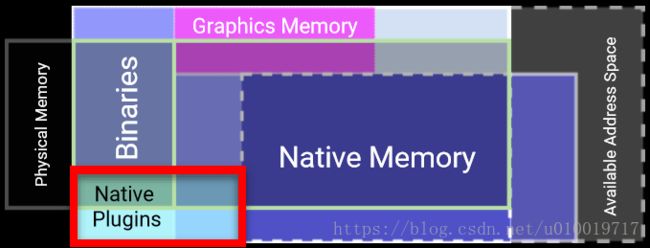
Native Plugins
• Native plugins do their own allocations in Malloc Heap
• Their code binaries are “Clean”
Mono Heap
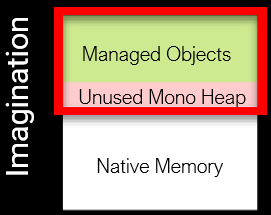
• A part of Native Memory allocated for the needs of the .NET Virtual Machine
• Contains all managed C# allocations, maintained by Garbage Collector
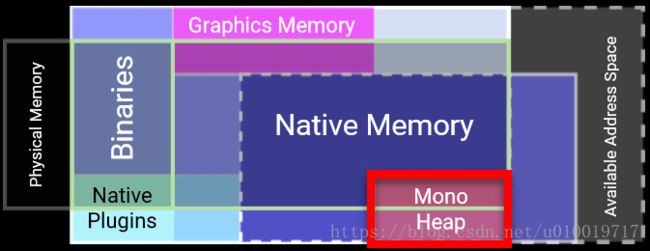
Mono Heap
• Mono Heap ![]() is not a large contiguous region of Native Memory
is not a large contiguous region of Native Memory
• It is allocated in blocks to store objects of similar size
• There can be allocated, committed but unused blocks
• If a block is still unused after 8 Garbage Collection passes, its Physical Memory will be returned to the system (decommitted)
iOS Memory Management
• iOS is a multitasking OS
• Each app works with its own Virtual Memory address space mapped to Physical Memory
• When the amount of free Physical Memory gets low, iOS starts trying to reduce memory pressure:
1. Removes Clean Memory pages (they can be safely reloaded later)
2. If the app takes too much Dirty Memory, iOS sends memory warnings
3. If the app fails to free resources, iOS terminates it
• We don’t know the details about this algorithm
• Sometimes an app can allocate more, sometimes less
Minimize the Size of Dirty Memory!
• Measure the app’s Dirty Memory and see if it grows over time,
• Reduce the amount of objects contributing to Dirty Memory,
• Note: some data can be compressed better.
• Reasonable limits of Dirty Memory:
• 180Mb for 512Mb devices,
• 360Mb for 1Gb devices,
• 1.2Gb for 2Gb devices.
• ... but, iOS can still kill the app
ToolsUnity Profiler | Simple View
• Mono (used) — the size of Mono Heap (the total sum of pink and green blocks)
• Mono (total) — the total committed memory for Mono Heap (the total size of pink, green and blue blocks)
• GfxDriver — the total size of 2D textures, excluding render targets
• FMOD — the total size of memory requested by FMOD (audio)
• Other values should be ignored:
• Total doesn’t include the size of game binaries, libs, frameworks, native plugins
• GfxDriver doesn’t include a lot of other allocations done by the Graphics Driver
• The Profiler only sees allocations done by Unity code
Unity Profiler | Detailed View
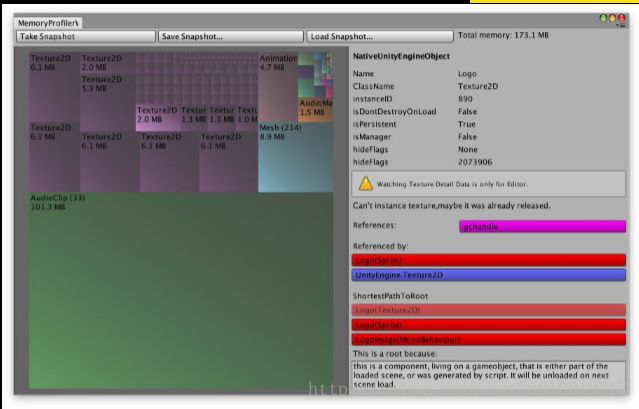
• Shows named objects in Native Memory and which objects reference them
• Assets folder shows how much Native Memory assets take
• Many large sounds
• Probably duplicated textures (have identical names)MemoryProfiler | BitBucket
• Shows a combination of:
• Assets (Virtual Memory),
• Assets (GPU)
• Managed objects (Mono),
• Object references
• Easy to see relative sizes
https://bitbucket.org/Unity-Technologies/memoryprofilerMemoryProfiler Extension | Github
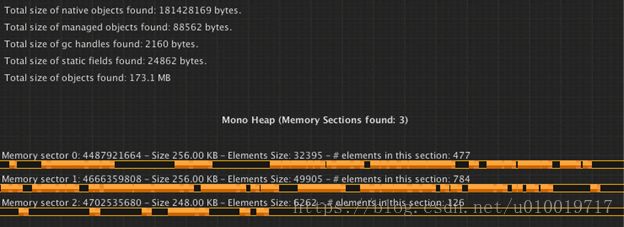
• We can see Mono Heap
• Total size: 256KB + 256KB + 128KB = 640KB
• Used: 86.5KB.
https://github.com/robertoardila/support-unity-memoryprofiler
Xcode Debug View
• Available in Xcode Debug Navigator view
• Shows if the app is doing OK memory wise
• Seems to be approximately Dirty Memory + Swapped Memory
• For detailed profiling should use Instruments
VM Tracker Instrument
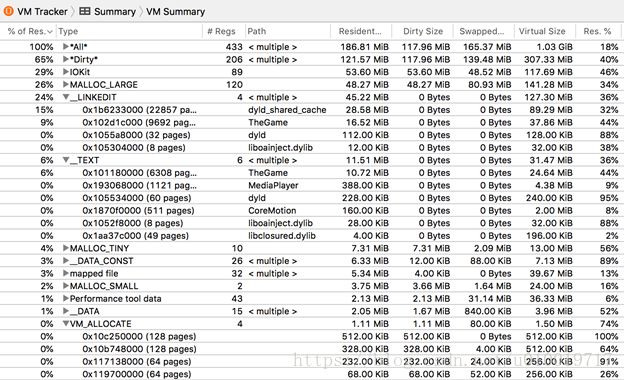
1. Total memory consumption:
a. The app has allocated 1GB of VM
b. It has committed 351MB (186+165)
c. But iOS has swapped 165MB
d. Now it is 186MB Physical Memory
e. 118MB of which is Dirty Memory
2. Binaries, libs and frameworks
a. They take Resident Memory
b. But they are not Dirty (i.e., Clean)

1. *All* — all allocations
2. *Dirty* — all Dirty allocations
3. IOKit — Graphics Driver
4. VM_ALLOCATE — Mono allocations + Heap
5. MALLOC_* — Malloc Heap
6. __TEXT + __LINKEDIT — app and lib binaries
7. __DATA — writable executable data
8. Perf. tool data — Instruments overhead
Allocations Instrument

Example | Parsing JSON
1. Load and parse a 350KB JSON file
2. GC.Collect()
3. 8x GC.Collect()
iPhone 6, iOS 11.3
Unity 2018.1
Step 0: Initial State
Different tools showing the same data:
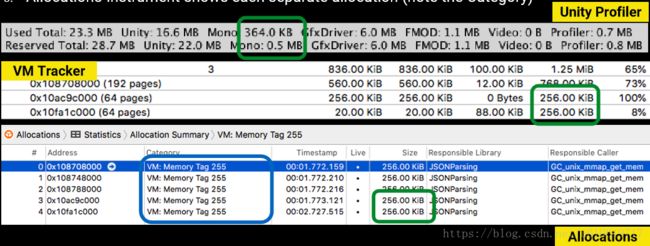
1. Unity Profiler shows 0.5MB committed but 364KB used
2. VM Tracker shows 1.25MB of allocations (in 3 blocks), 0.5MB of which is Mono Heap
3. Allocations Instrument shows each separate allocation (note the Category) Unity Profiler
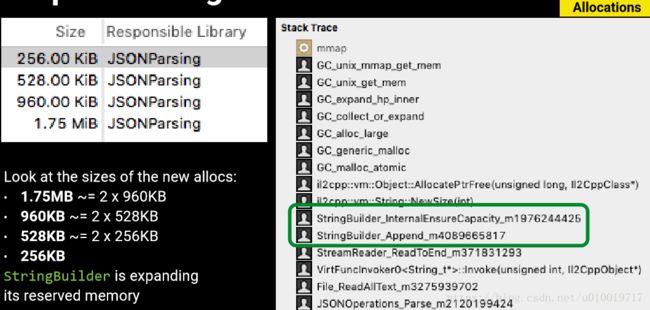
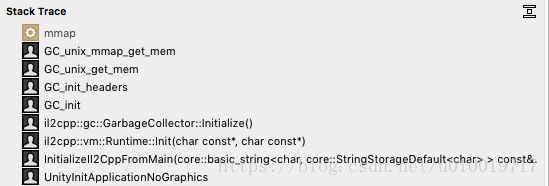
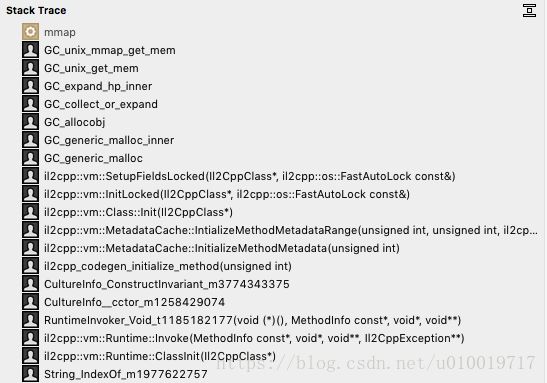
Allocations Instrument shows call stack for all allocations:
1. The first 4 allocations were done during IL2CPP initialization
2. The 5th allocation was done when creating a managed object

• Two blocks of Mono Heap
• Total size of Managed objects: 58KB
• Notice the fragmentation
Step 1: Parsing JSON
1. Notice how expensive the operation was
2. Total memory allocated during the process: 5.6MB
3. But Mono Heap size hasn’t increased that much
4. Because GC has run a few times to reclaim it

• Allocations Instrument shows new allocations
• The same allocated blocks can be seen in VM Tracker
• Notice that allocations (2) and (3) are in the same block
• Mono Heap takes ~4MB of Virtual Memory, all of it is Dirty
1. Mono Heap size, was: 3.0MB, now: 2.0MB
2. Allocated Mono memory — no change
3. Virtual Machine still has the same amount of committed memory
4. Some of it is compressed
1. 8x GC.Collect() calls is expensive
2. Unity Profiler shows that the reserved Mono Heap size has decreased
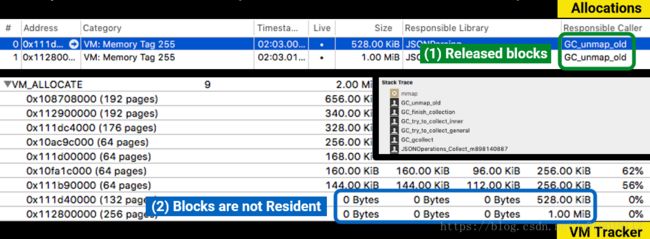
1. Two committed blocks were released
2. They still reserve Virtual Memory but don’t contribute to Resident Memory
Understanding Memory on iOS : http://bit.ly/ios-memory
Understanding iOS Memory (WiP)
Written by Valentin Simonov, last updated on 26.04.2018.
https://docs.google.com/document/d/1J5wbf0Q2KWEoerfFzVcwXk09dV_l1AXJHREIKUjnh3c/edit#heading=h.igf7mj98s1r4
Slides from Unite Korea: link.
Properly managing memory on iOS devices isextremely important, since not doing so will get a game terminated by the OS,resulting in what a user would perceive as a crash. Users usually don’t likewhen games crash and tend to leave one-star reviews.
To assess a game’s memory consumption, it isadvised to frequently profile the game on target devices, looking for crashesand memory leaks. For this purpose Unity and Apple provide profiling toolswhich if used correctly can tell a Unity developer everything she needs to knowabout the game.
The tools provided are thefollowing:
- Unity Memory Profiler
- MemoryProfiler (on BitBucket
) - MemoryProfiler Extension (on Github)
- Xcode memory gauge in Debug Navigator view
- VM Tracker Instrument
- Allocations Instrument
Kinds of Memory
When a developer asks the question “how muchmemory does my game use?”, usually one of these tools has a good answer. Theproblem, however, is that the question is ambiguous — the word “memory” canmean several different kinds ofmemory. So it is critical to understand what kind of memory the question is referring to. The existence ofdifferent kinds of memory is whatcreates a layer of confusion and deems the topic of memory on iOS toocomplicated to bother.
This document describes the nature of memoryin iOS and goes into details of what data the mentioned tools provide. Theinformation provided is applicable to other platforms, but differences inimplementation are not discussed here.
System Memory
Physical Memory (RAM)
PhysicalMemory is the physical device memoryon-chip inside an iPhone or iPad.
It has a physical limit (for example 512Mb or1Gb) and just can’t hold more data. Each running application occupies someamount of Physical Memory, but inmodern operating systems (like iOS) applications never work directly withmemory on-chip. Instead, they deal with so-called Virtual Memory which the OS seamlessly maps into Physical Memory.
Virtual Memory (VM)
VirtualMemory is what the game sees as itsaddress space, where it can allocate memory and hold pointers to that memory.
When a process starts, the OS creates alogical address space (or “virtual” address space) for the process. It's called"virtual" because the address space exposed to the process does notnecessarily align with the physical address space of the machine, or even thevirtual address space of other applications.
The OS divides this address space intouniformly-sized chunks of memory called pages. The processor and its memorymanagement unit (MMU) maintain a page table to map pages in the process’slogical address space to hardware addresses in the computer’s RAM. When anapplication’s code accesses an address in memory, the MMU uses the page tableto translate the specified logical address into the actual hardware memoryaddress. This translation occurs automatically and is transparent to therunning application.
In earlier versions of iOS, the size of apage is 4 kilobytes. In later versions of iOS, A7- and A8-based systems expose16-kilobyte pages to the 64-bit userspace backed by 4-kilobyte physical pages,while A9 systems expose 16-kilobyte pages backed by 16-kilobyte physical pages.
VirtualMemory consists of several regions,including code segments, dynamic libraries, GPU driver memory, malloc heap andothers.
GPUDriver Memory
GPUDriver Memory consistsof allocations in Virtual Memory usedby the driver and essentially being video memory on iOS.
iOS features so-called unified architecture,where CPU and GPU share the same memory (though on modern hardware GPU hashigher bandwidth to this memory). The allocations are done by the driver andmostly consist of texture and mesh data.
MallocHeap
MallocHeap is a Virtual Memory region where an application can allocate memoryusing mallocand callocfunctions.
In other words, this is a chunk of virtualaddress space available for the application’s memory allocations.
Apple doesn’t publish the maximum size of Malloc Heap. In theory, Virtual Memory address space is onlylimited by pointer size, which is defined by the processor architecture, i.e.,roughly 4 gigabytes of logical memory space on 32-bit processors, and 18exabytes on 64-bit processors. But in reality, the actual limits seem to dependon device and iOS version and are much lower than one might think. A simple appwhich continuously allocates VirtualMemory gives the following values:
Device |
iOS |
SoC |
Heap |
iPad Mini 2 |
11.2.1 |
A7 |
2.08 GB |
iPhone 6 |
10.3.3 |
A8 |
2.08 GB |
iPhone SE |
11.1.2 |
A9 |
3.43 GB |
iPad Pro 9.7 |
11.2.5 |
A9X |
3.47 GB |
iPhone 7 |
11.2.6 |
A10 |
3.40 GB |
iPad Pro 10.5 |
11.2.5 |
A10X |
7.40 GB |
iPhone 8 |
11.2.1 |
A11 |
3.40 GB |
iPhone X |
11.3 |
A11 |
3.42 GB |
Theoretically, it is possible to exhaustVirtual Memory address space by using too many memory-mapped files.
Resident Memory
ResidentMemory is the amount of Physical Memory the game actually uses.
A process can allocate a block of memory fromVirtual Memory, but for the OS toactually reserve a corresponding block of PhysicalMemory the process has to write to this block. In this case, the allocatedblock of memory will become a part of the application’s Resident Memory.
Paging
Paging is a process of moving Physical Memory pages in and out from memory to a backing store.
When a process tries to allocate and use ablock of Virtual Memory, the OS looksfor free memory pages in Physical Memoryand maps them to the allocated VirtualMemory pages (thus making these pages a part of the application’s Resident Memory).
If there are no free pages available in Physical Memory, the OS tries to releaseexisting pages to make room for the new pages. How the system releases pagesdepend on the platform. Usually, some pages deemed rarely used are moved to abacking store like a page file on disk. This process is known as paging out.
But in case of iOS, there is no backingstore, so pages are never paged out to disk. Though, read-only pages can stillbe removed from memory and reloaded from disk as needed. This process is known aspaging in.
If an application accesses an address on amemory page that is not currently in PhysicalMemory, a page fault occurs. When that happens, the Virtual Memory system invokes a special page-fault handler torespond to the fault immediately. The page-fault handler stops the currentlyexecuting code, locates a free page of PhysicalMemory, loads the page containing the needed data from backing store,updates the page table, and then returns control to the program’s code.
Clean Memory
CleanMemory is a set of read-only memorypages from application’s Resident Memorywhich iOS can safely remove and reload from disk when needed.
Memory allocated for the fo
llowing data is considered Clean:
- System frameworks,
- Application’s binary executable,
- Memory mapped files.
When an application links to a framework, Clean Memory set will increase by thesize of the framework binary. But most of the time, only a part of the binaryis loaded in Physical Memory.
Because CleanMemory is read-only, applications can share parts of Clean Memory like common frameworks and libraries, as well as otherread-only or copy-on-write pages.
Dirty Memory
DirtyMemory is a part of Resident Memory which can’t be removedby the OS.
<...>
Swapped Compressed Memory
Swapped (Compressed)Memory is a part of Dirty Memory which the OS deemed rarelyused and stores in a compressed memory region.
The algorithm used to move and compress thesememory blocks is not open, but tests show that iOS usually aggressively triesto do this, thus reducing the amount of DirtyMemory for the application.
Unity Memory
Unity is a C++ game engine with a .NETscripting Virtual Machine. Unityallocates memory for native (C++) objects and memory needed for the Virtual Machine from Virtual Memory. Also, third-partyplugins can do their allocations from the VirtualMemory pool.
Native Memory
NativeMemory is the part of the game’s Virtual Memory which is used for native(C++) allocations — here Unity allocates pages for all its needs, including Mono Heap.
Internally Unity has several specializedallocators which manage Virtual Memoryallocations for short-term and long-term needs. All the assets in the game arestored in Native Memory, while beingexposed as lightweight wrappers for the .NET Virtual Machine. In other words, when a Texture2D object is created in C# code, the biggestpart of it, actual texture data, is allocated in Native Memory, not in the MonoHeap (though most of the time it is uploaded “on GPU” and discarded).
Mono Heap
Mono Heap is a part of Native Memory allocated for the needs of the .NET Virtual Machine. It contains all themanaged C# allocations and is maintained by the Garbage Collector.
Mono Heap is allocated in blocks which store managedobjects of similar size. Each block can store some amount of such objects andif it stays empty for several GC passes (8 passes in the time of writing oniOS) the block is decommitted from memory (i.e., its Physical Memory is returned to the system). But Virtual Memory address space allocatedby the GC is never freed[1] and can’t be used by any other allocator inthe game.
The issue with the blocks is that they areusually fragmented and might contain just a few objects out of a capacity ofthousands. Such blocks are still considered used, so their Physical Memory can’t be returned to the system. Unfortunately,this is usually the case in real-world scenarios, while it is easy to constructan artificial example where Mono HeapResident Memory will grow and shrink at will.
iOS Memory Management
iOS is a multitasking operating system; itallows applications coexist in the same environment. Each application with itsown Virtual Memory address spacemapped to some portion of Physical Memory.
When the amount of free Physical Memory gets low (either because too many applications areloaded, or the foreground application consumes too much Physical Memory), iOS starts trying to reduce memory pressure.
- First, iOS tries to remove some Clean Memory pages,
- If it deems an application to take too much Dirty Memory, iOS sends a memory warning to the application, expecting it to free some resources,
- After several memory warnings, if the application still uses a significant amount of Dirty Memory, iOS terminates the application.
Unfortunately, the decision process to killan application is not transparent. It seems that this decision depends on totalmemory pressure, the internal state of kernel memory manager and how manystrategies the OS has already tried to minimize the pressure. Only when itexhausts all the strategies, it decides to kill currently active application.That’s why sometimes an application can be stopped quite early, while next timeit allocates 30% more and still survives.
The most important metric to observe tryingto investigate OOM crashes is DirtyMemory, because iOS is unable to remove dirty pages to provide free pagesfor new allocations. This means that to fix memory related issues, a developermust do the following:
- Find out how much Dirty Memory the game uses and if the usage grows over time.
- Figure out what objects contribute to the game’s Dirty Memory and can’t be compressed.
Reasonably safe limit values of Dirty Memory for different iOS devices(from what we have seen in the wild):
● 180Mb for512Mb devices,
● 360Mb for1Gb devices,
● 1.2Gb for2Gb devices.
Note that even if your application fallsunder these recommended limits, eviction from iOS is still possible. Goingbeyond this further increases the chance of eviction on iOS.
The Tools
Now, that the fundamental terminology isestablished, this section will focus on the tools and data they can provideabout a game.
Unity Profiler
TheProfiler ships with Unity editor and canbe used to profile various aspects of the game either in the editor orconnected to a device running a DevelopmentBuild of the game. Memory tab of the Profiler window shows many aggregatedstatistics about the game’s memory usage.
Best Used For
The Profiler shows the actual named assetsoccupying Virtual Memory and thenumber of references to them in the game. It is the most accessible tool toinspect what assets are in memory and why they are there. Other tools show alot more details about allocations and the code doing these allocations, but itis tough to find out what exactly was allocated and why it is still in memory.
The Profiler also shows the actual size of Mono Heap.
Simple View
Unity reserves memory pools for allocationsin Native Memory to avoid asking theOS too often — this is displayed as “Reserved.”The amount of Reserved memory actually used by Unity is displayed as “Used.”
The “Simple” view displays the amount of Virtual Memory allocated for thefollowing (provided for iOS/Metal, might be different on other platforms):
● GfxDriver — the total size of textures excluding render targets (doesn’tinclude many other driver allocations),
● FMOD — the overall size of memory requested by FMOD for audioplayback,
● Profiler — Profiler overhead,
● Video — the memory used for playing video files,
● Mono
○ Reserved — the total Resident Memorysize of used and unused memory blocks of Mono Heap,
○ Used — the total Resident Memorysize of used memory blocks (i.e., the current size of Mono Heap),
○ Note: the actual size of managed objects is less than Used size and is not shown here.
● Unity — all reserved and used memory managed by Unity allocators minus
● Total — for some reason).
The TotalReserved memory is by no means the accurate value of Virtual Memory allocated by the game:
- This data doesn’t include the size of the game’s binary executables, loaded libraries, and frameworks.
- GfxDriver value doesn’t include render targets and various buffers allocated by the driver.
- The Profiler only sees allocations done by Unity code; it doesn’t see allocations by third-party native plugins and by the OS.
DetailedView
The “Detailed” view displays the Virtual Memory allocated by differentobjects in the engine. It is handy for finding out the actual sizes of thegame’s assets and whether whether something uses these assets or not.
● Assets — currently loaded assets from scenes, Resources or AssetBundles,
● Built-in Resources — Unity Editor resources or Unity default resources,
● Not Saved — GameObjects marked as DontSave,
● Scene Memory — GameObject and attached components,
● Other — objects not assigned in the above categories.
Usually, the most interesting data can be foundin the Assets section.
For example, here it is evident that thesound compression settings are wrong and these audio clips take way too muchmemory.
In this view, it is also easy to spotduplicated textures with identical names. Not all the textures with the samename are duplicated, but it is usually a good idea to check.
Not Saved and SceneMemory sections might contain dynamically created assets which were notGCd. A leaked asset can be identified by the lack of value in the Ref count column, which means that noother asset or code is referencing it.
The most significant contributors to thememory pool in Other section areactually misleading.
● Objects — objects are various classes that derive from NamedObject, i.e.,GameObjects, Textures, Meshes, Components, etc. This value should be the sum ofobjects from other sections, but it seems that it got broken at some point andis not relevant anymore. In any case, this is not “some other objects on top of already allocated memory” and can beignored.
● System.ExecutableAndDlls — Unity tries to guess the memory consumedby loaded binary code by summing up file sizes. <...>
● ShaderLab — these are all allocations related to compiling shaders. Shadersthemselves have their own object root and are listed under Shaders.
MemoryProfiler (on Bitbucket)
This is an experimental tool based on MemoryAPI introduced in Unity 5.3. When connected to a game built with IL2CPP, it cangraph memory regions Unity knows about. The tool is available on BitBucket and is not shipped with Unity.
This tool augments the data from the Profilerby
- Proportionally drawing the size of allocations,
- Saying why these allocations are still in memory (who references them),
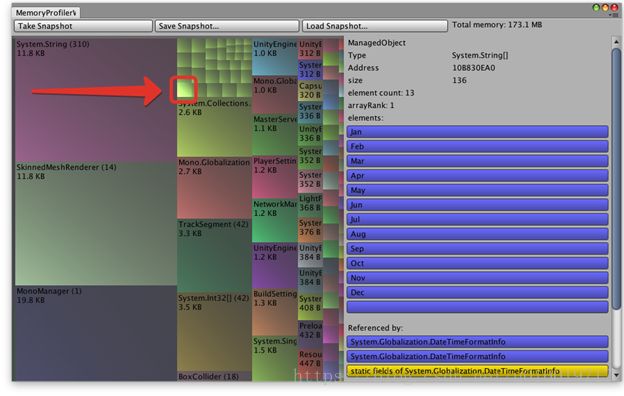
- It shows managed objects.
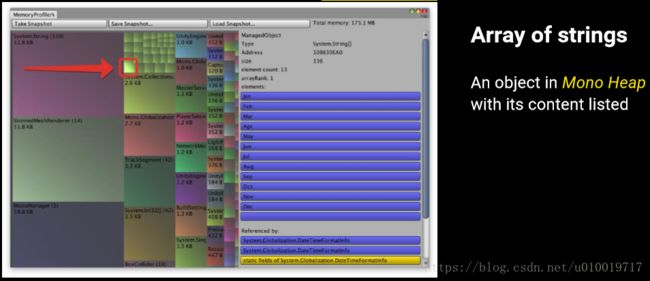
For example, this is an array of stringsdisplayed by the tool:
Best Used For
MemoryProfiler is a great tool to visuallymap Native Memory and find groups ofmanaged objects which occupy too much of it.
MemoryProfilerExtension (on Github)
Using the same memory API the previous toolutilizes, Unity Support Team has prototyped an extended tool which canvisualize Mono Heap. It is availableon Github.
Best Used For
This tool nicely displays the structure of Mono Heap and is a great instrument tolearn how memory for the heap is allocated and used.
Xcode Memory Gauge
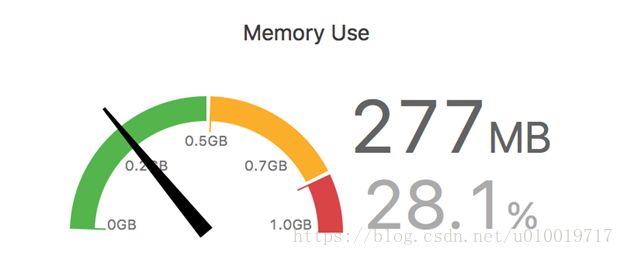
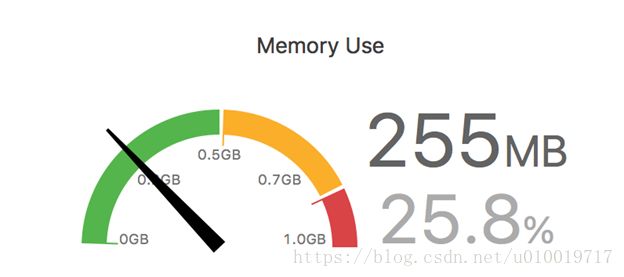
When running an application from Xcode, theIDE shows a few gauges in Debug Navigatorview, one of which displays a number corresponding to currently used memory.
Unfortunately, it is not entirely known whatthis bar shows. The maximum value is the total size of Physical Memory. The value seems to be 10-15MB larger than Dirty Memory + Swapped Memory reported by VMTracker Instrument discussed further. It seems that when the value getsinto the yellow zone, the application is soon terminated by the OS.
It is wrong to say that this single number isthe only one used to decide when to terminate an application. As mentioned in“iOS Memory Management” section, the actual process is not thatstraightforward.
Best Used For
The value displayed by this gauge is rather aheuristic to see if the application is doing OK memory wise or not. It shouldbe used only to observe the overall trend of the application memoryconsumption. For precise profiling, developers are advised to use Instruments.
VM Tracker Instrument
The VM Tracker instrument capturesinformation about Virtual Memoryusage by a process. It shows all memory blocks in the application’s addressspace labeled with the block type and which library reserved it. For eachreserved memory block, the tool displays its size in Virtual Memory, as well as how much Resident, Dirty and Swapped Memory the block takes.
Best Used For
VM Tracker gives the mostdetailed information about the state of a process’ memory and is the only toolwhich reports the size of its DirtyMemory set. Other interesting details include the size of graphics driverallocations (essentially the Video Memory),the size of application binaries in memory and the total volume of reserved andcommitted Mono Heap.
Unfortunately, the tool doesn’treport what the memory is allocated for and when. For this purpose, we adviseusing Allocations Instrument and Unity Profiler.
Starting a Profiling Session
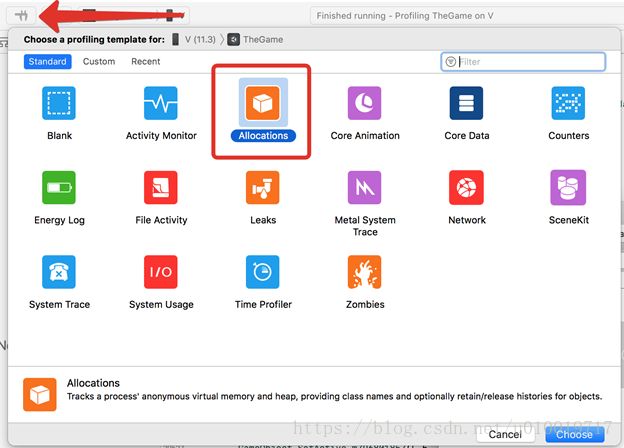
To profile a game with Instruments, it must either be launchedfrom a specific Instrument or the Instrument must be connected while thegame is launched. To start profiling from Xcode, the game must be launchedusing Profile button, and the Allocationsinstrument must be chosen.
After that, to launch the gamepress Record button.
After the game starts, select VM Tracker rowin the timeline and either manually press SnapshotNow button or check AutomaticSnapshotting to do this at specific time intervals.
Data
After a snapshot is done, theInstrument will display data like this:
The following summary columns are availablein the detail pane:
● Type — the name of the memory being used,
● Resident Size — the amount of ResidentMemory being used by allocation or a group of allocations,
● Dirty Size — the amount of DirtyMemory used by allocation or a group of allocations,
● Swapped Size — the amount of CompressedSwapped Memory used by allocation or a group of allocations,
● Virtual Size — the total size of VirtualMemory used by allocation or a group of allocations,
● Res. % — the percentage of ResidentMemory compared to the amount of allocated Virtual Memory.
VM Tracker shows groups of allocations pertype and how much they contribute to DirtyMemory and Virtual Memory. Themost common groups are:
● *All* — all allocations,
● *Dirty* — a group of all types which contribute to Dirty Memory,
● IOKit — graphics driver memory, i.e., render targets, textures, meshes,compiled shaders, etc.,
● VM_ALLOCATE — mainly allocations for MonoHeap. If this value is large, it is easier to use Unity Profiler to find what managed code is responsible for theseallocations,
● MALLOC_* — mainly Unity native allocations or allocations by third-partyplugins,
● __TEXT — non-writable executable code and static data,
● __DATA — writable executable code/data,
● __LINKEDIT — raw data used by the dynamic linker, such as symbol, string,and relocation table entries.
By looking at the groups and how much theycontribute to Virtual Memory and Dirty Memory, it is easy to startpinpointing the source of excessive memory consumption.
RegionsMap
VMTracker instrument has thesecond view which is called Regions Map— this is a list of memory regions with some information about each region. Bylooking at this view, it is easy to see how VirtualMemory address space is structured for a process.
It is also clear that, for example, Mono Heap blocks are not contiguous inmemory.
Allocations Instrument
AllocationsInstrument shows individual allocations inthe application’s address space done by any native code on all threadsincluding Unity native code, Garbage Collector, IL2CPP Virtual Machine,third-party plugins. The tool displays allocations for a selected time frame ina list or in the application’s call stack. It is handy to see which code anallocation originated from.
Best Used For
AllocationsInstrument is very useful for reviewingnative allocations at any point in the application’s lifecycle. It shows whatcode made the allocation, from which sometimes it is possible to infer what wasallocated and why.
Starting a Profiling Session
This instrument is coupled with VM Tracker, so the starting procedure isthe same. To see the data gathered by the instrument, select its row in thetimeline view and select a time frame on that row (by clicking and dragging).
Recommended settings are the following:
Data
The most useful view of the instrument is theCall Trees view. It displays theapplication’s call stack per thread and how much memory each branch hasallocated in total.
Here a part of game code originating at UnityEvent.Invokeis shown. It is clear that the code goes to create an instance of Pooler classwhich clones some prefabs thus allocating memory for its copies.
All VirtualMemory allocated for the needs of the .NET Virtual machine can be found inthe following category:
All individual allocations can be seen ifclicked on the category.
The tool conveniently shows the code wherethe selected allocation originated from. In this case, the first fourallocations are done while initializing the IL2CPP runtime.
But the very last allocation was done whiletrying to initialize a managed object.
Experiments
Sample Game
To illustrate the usage of the tools, anexample project was created using a free sample project from Asset Store. Unlike abstract tests, profiling this project gives the dataclose to what a developer would see when profiling his or her game.
The game consists of two scenes: Main Menuand Gameplay.
Hardware used: iPhone 6 with iOS 11.3.
UnityProfiler
When the game starts, Unity Profiler shows the following data.
![]()
- Mono Heap size is 0.6Mb,
- The project uses 54.6Mb of textures,
- Audio data uses 102.7Mb (which is a lot),
- 90.9Mb of Reserved Total should be ignored.
Detailed view gives some more informationabout the objects occupying memory. Each group can be expanded, and each itemexamined. This data can be used to find large assets and duplicated assets inmemory.
When the game is started, Unity Profilerdisplays the following data in Simple View.
![]()
- Mono Heap is now 1.2Mb,
- There are fewer textures used,
- But more audio clips.
Detailed view shows that there are actuallyfewer graphics assets used in the game than in the Main Menu scene.
MemoryProfilerExtension
This tool gives more information about Mono Heap. It is easy to see thefragmentation.
Totalsize: 256KB + 256KB + 128KB = 640KB
Used: 88 562B.
After loading the Game scene.
Totalsize: 256KB + 256KB + 256KB + 272KB +304KB = 1 344KB.
Used: 510KB.
Xcode
Next, the game is started from Xcode. Whilein Main Menu scene Xcode shows thefollowing.
But in game, the memory grows.
In both cases, Xcode reports that theapplication’s memory status is OK and the project runs fine on this device.
VMTracker Instrument
Immediately after the game loadsthe Main Menu scene, VM Tracker reports the following data.
- Total Virtual Memory allocated — 1.03GB,
- Total Virtual Memory used — 186.81MB (Resident) + 165.37MB (Swapped) = 352.18MB,
- Total Physical Memory used — 186.81MB,
- Total Dirty Memory — 117.96MB,
- Graphics driver memory (IOKit) — 117.69MB,
- Allocated Virtual Memory by Unity — 141.28MB (MALLOC_LARGE) + 13.00MB (MALLOC_TINY) + 24.00MB (MALLOC_SMALL) = 178.28MB,
- One of the allocations (under MALLOC_LARGE) looks like the FMOD memory:
- Allocations under __LINKEDIT and __TEXT have zero Dirty Memory — these are read-only parts of the executable and libraries which can be reloaded from disk when needed,
- VM_ALLOCATE is 1.50MB and is roughly Mono Heap.
The next snapshot (3 secondslater) looks like so:
SwappedMemory size has increased — iOS isaggressively trying to page out some memory pages into a compressed store.
Next, when the game scene isloaded:
- IOKit memory is decreased,
- Unity has allocated more memory (MALLOC_LARGE),
- Mono Heap is increased (VM_ALLOCATE).
Allocations Instrument
Allocations Instrument shows thefollowing:
1. Audio data allocated by FMOD from a loadingthread,
2. A lot of other scene objects are loaded froma loading thread,
3. Another thread manages uploading textures onGPU,
4. The code loads bundles; Unity allocatesmemory for I/O operations,
- There are also a lot of invisible things going on under the hood, like IL2CPP VM initializing class and method metadata.
Parsing JSON
This project simulates a usual task ofloading and parsing a large JSON file. It has three stages:
- The game loads and parses a 350KB JSON file from StreamingAssets,
- After that, it calls GC.Collect(),
- And the last step is calling GC.Collect() 8 times in a row.
Hardware used: iPhone 6 with iOS 11.3.
Step0: Initial State
When the test project is first launched, Unity Profiler reports the followingmemory state:
![]()
VM Tracker:
Allocations:
MemoryProfiler Extension:
Step1: Parsing JSON
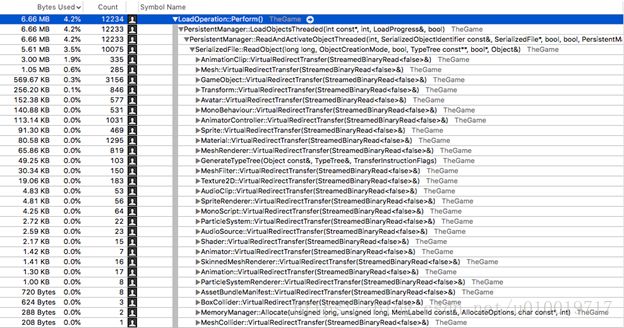
Unity CPUProfiler tab shows how expensive thisoperation was — 0.5 seconds and 5.6MB allocated to load and parse the JSONfile. Note that GC.Collect has run seven times during this period cleaning someintermediately accumulated garbage and not letting Mono Heap expand much further.
UnityProfiler displays the following stateafter JSON data has been loaded and parsed.
![]()
VM Tracker:
New allocations displayed by the AllocationsInstrument.
Note that all of them are roughly twice asbig as the previous one. This is explained by the call stack which is identicalfor all allocations — this is StringBuilder expanding by doubling in size each time.
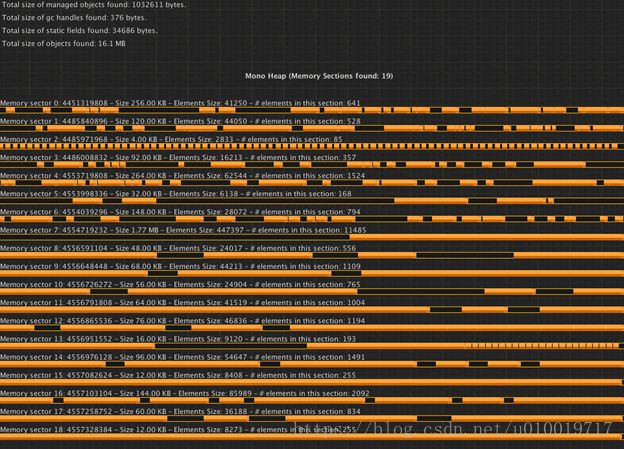
Mono Heap state. Note that it is heavily fragmentedand managed objects actually occupy only about 1MB of it.
Step2: GC.Collect()
After calling GC.Collect()Unity reports the following memory state:
![]()
But Instruments report no changes at all.Only that iOS has compressed a big part of MonoHeap.
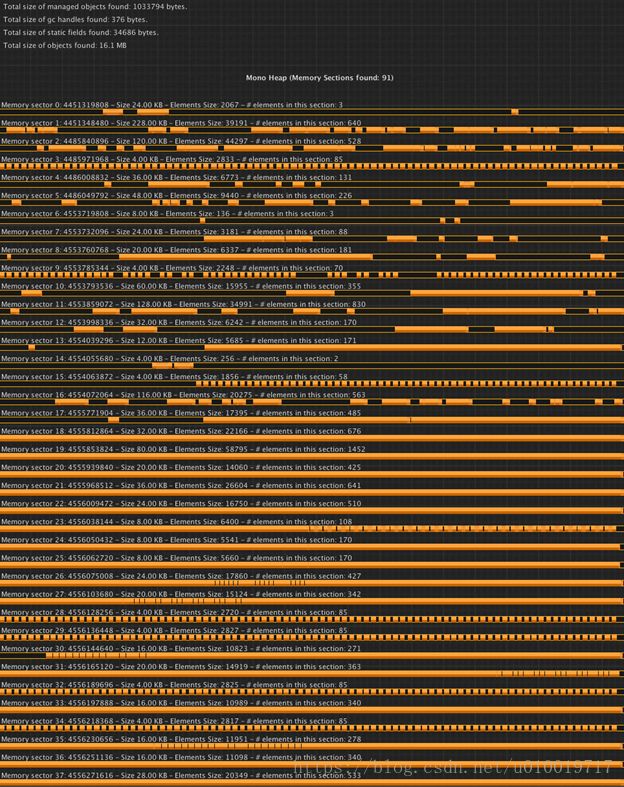
Mono Heap now looks like this (with asignificant portion of sections not visible on one screenshot).
Step3: GC.Collect() x8
First of all, calling GC.Collect() several times per frame is rather expensive.
Memory state reported by Unity Profiler after this operation.
![]()
Allocationsinstrument indeed reported decommitting twomemory regions of the 1.5MB total.
VMTracker still reports them as allocated,but they don’t contribute to ResidentMemory set anymore (the two bottom entries).
The MonoHeap state is pretty much the same.

