matplotlib.animation制作动画实现流式数据实时监控
参考:matplotlib_Animation 动画
animation官方API文档
animation制作动画主要是分为动画框架的初始化(坐标轴)以及具体横纵坐标数值的不断更新,动画的不断刷新主要靠FuncAnimation函数,参考官网介绍FuncAnimation函数通过重复调用函数func来制作动画。
class matplotlib.animation.FuncAnimation(fig, func, frames=None,
init_func=None, fargs=None, save_count=None, *, cache_frame_data=True,
**kwargs)
重要参数介绍:
init_func:callable,optional
用于绘制清晰框架的功能。 如果未给出,将使用帧序列中第一项的绘制结果。 在第一帧之前将调用此函数一次。
func:callable
在每一帧调用的函数。 第一个参数是帧中的下一个值。 可以通过fargs参数提供任何其他位置参数。
fargs : tuple or None, optional
传递给func的每个调用的附加参数。(下面第二例有用到,传入横纵坐标)
interval:number,optional
帧之间的延迟(以毫秒为单位), 默认为200。
下面是官网的一个例子,注释参考链接的一篇博客
from matplotlib import pyplot as plt
from matplotlib import animation
import numpy as np
fig, ax = plt.subplots()
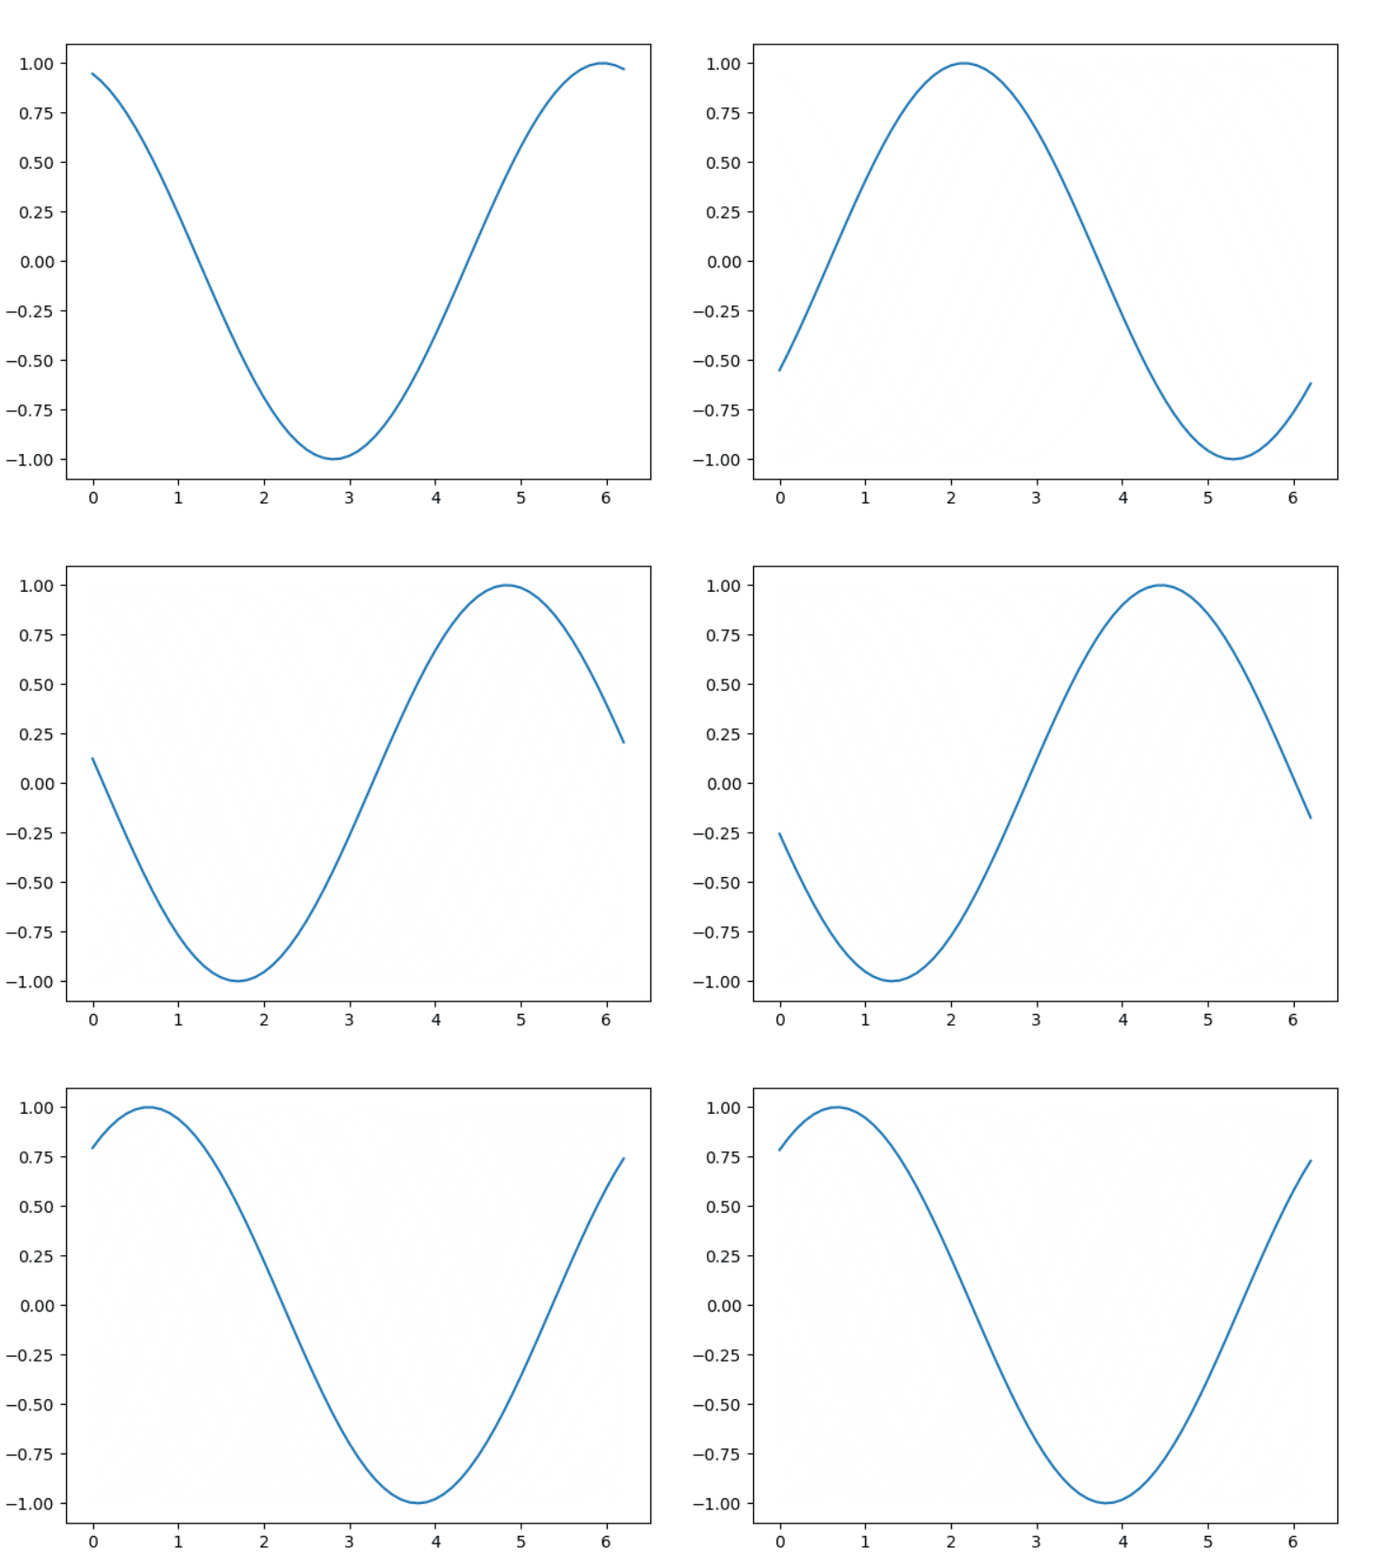
#我们的数据是一个0~2π内的正弦曲线
x = np.arange(0, 2*np.pi, 0.1)
line, = ax.plot(x, np.sin(x))

#接着,构造自定义动画函数update,用来更新每一帧上各个x对应的y坐标值,参数表示第i帧
def update(i):
    line.set_ydata(np.sin(x + i/10.0))
    return line,
#然后,构造开始帧函数init
def init():
    line.set_ydata(np.sin(x))
    return line,
#接下来,我们调用FuncAnimation函数生成动画。参数说明:
#fig 进行动画绘制的figure
#func 自定义动画函数,即传入刚定义的函数update
#frames 动画长度,一次循环包含的帧数
#init_func 自定义开始帧,即传入刚定义的函数init
#interval 更新频率,以ms计
#blit 选择更新所有点,还是仅更新产生变化的点。应选择True,但mac用户请选择False,否则无法显示动画

ani = animation.FuncAnimation(fig=fig,
                              func=update,
                              frames=100,
                              init_func=init,
                              interval=20,
                              blit=False)
plt.show()
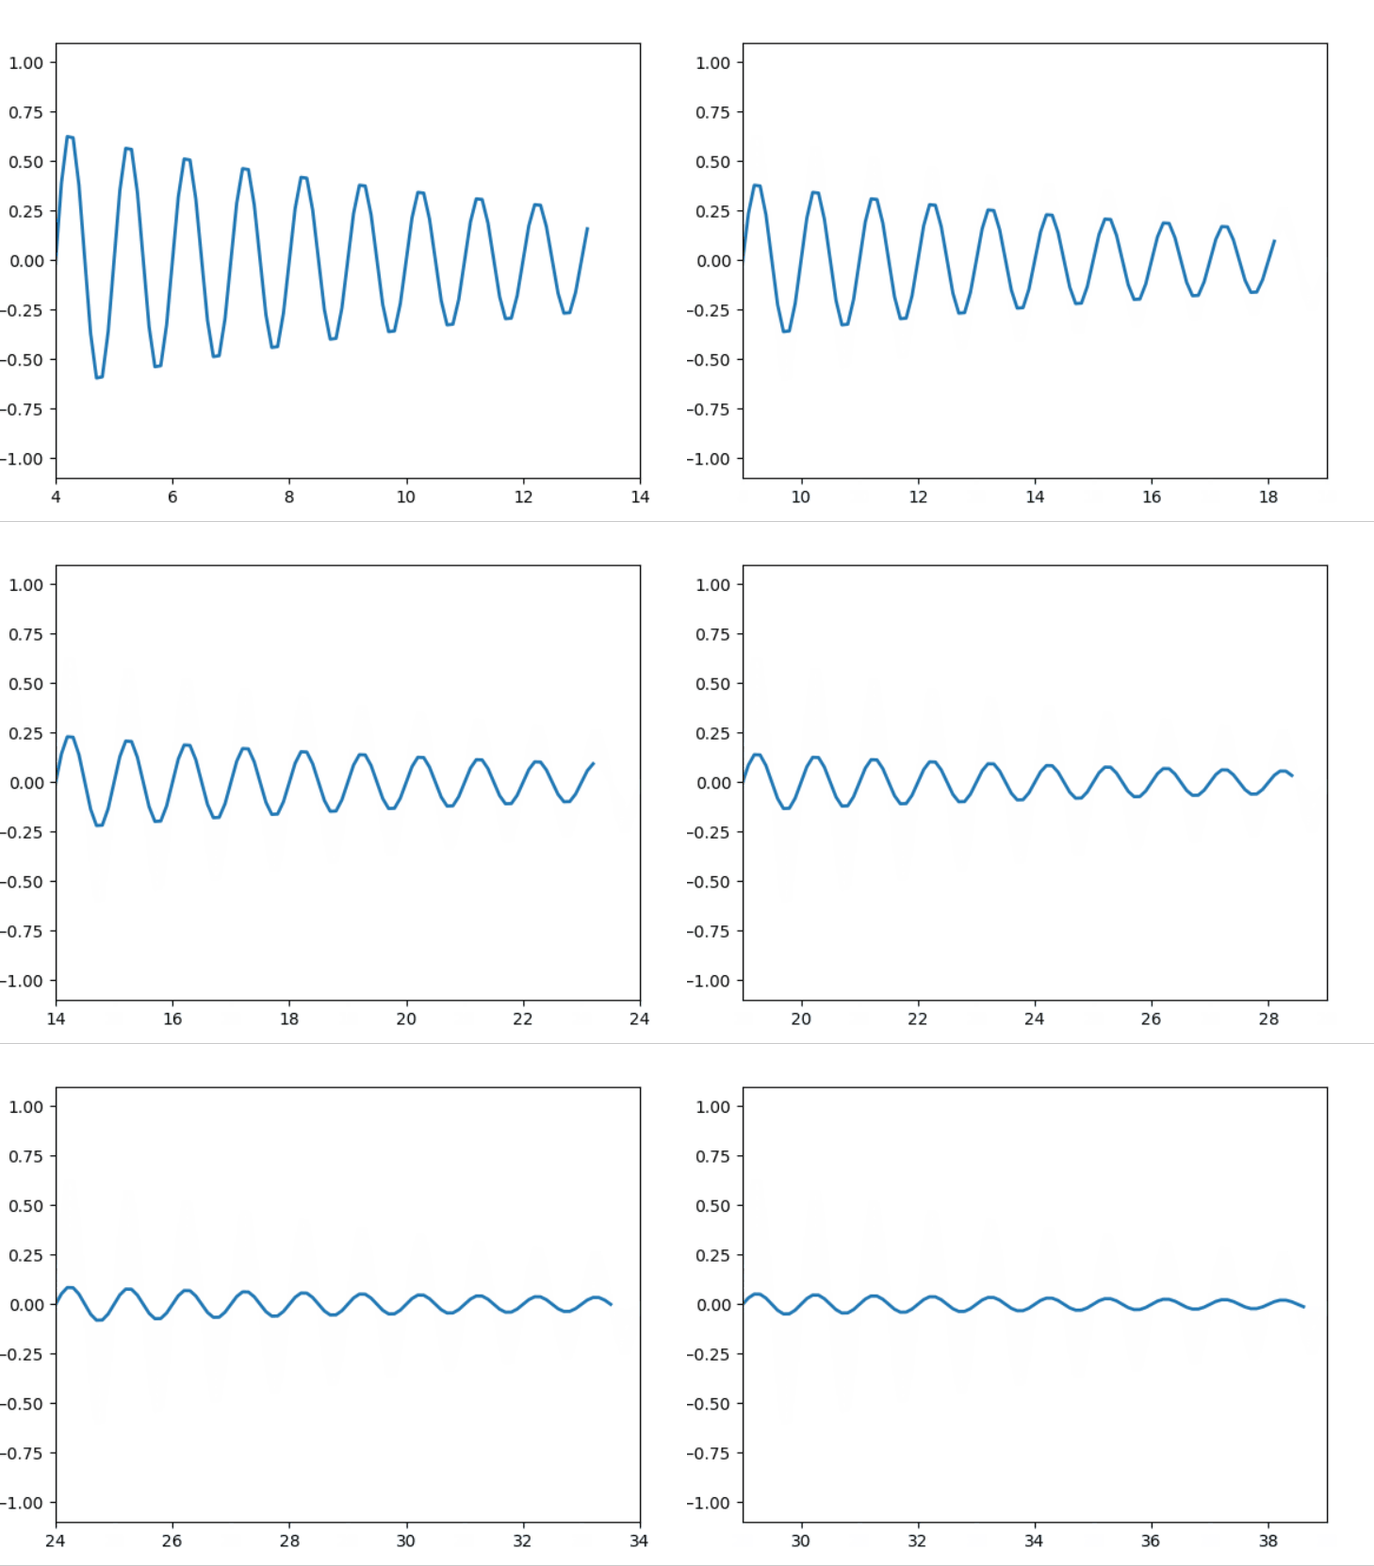
下面是matplotlib官网给出的一个用animation 实现的衰减函数样例。
使用生成器来驱动动画,在动画过程中更改轴限制,此例为更改横坐标。
import numpy as np
import matplotlib.pyplot as plt
import matplotlib.animation as animation
#此函数用于更新传入run函数的横纵坐标数据,在这里定义好需要实现的函数图像
def data_gen(t=0):
    cnt = 0
    while cnt < 1000:
        cnt += 1
        t += 0.1                                         #横坐标
        yield t, np.sin(2*np.pi*t) * np.exp(-t/10.)      #生成x,y坐标

def init():
    ax.set_ylim(-1.1, 1.1)          #初始化横纵坐标
    ax.set_xlim(0, 10)
    del xdata[:]
    del ydata[:]
    line.set_data(xdata, ydata)
    return line,

fig, ax = plt.subplots()
line, = ax.plot([], [], lw=2)
#ax.grid()                         #根据是否需要生成网格调整
xdata, ydata = [], []

def run(data):
    # update the data
    t, y = data
    xdata.append(t)
    ydata.append(y)
    xmin, xmax = ax.get_xlim()      #获取横坐标的最大最小值
    if t >= xmax:                   #当数据横坐标超出图像最大横坐标时
        #ax.set_xlim(xmin, 2*xmax)  #官网样例是横坐标最大值翻倍
        ax.set_xlim(xmin+1,xmax+1)  #我将其改成整体横坐标向右平移一个单位
        ax.figure.canvas.draw()
    line.set_data(xdata, ydata)

    return line,

ani = animation.FuncAnimation(fig, run, data_gen, blit=False, interval=10,
                              repeat=False, init_func=init)
plt.show()
import math
import numpy as np
import matplotlib.pyplot as plt
from matplotlib.animation import FuncAnimation


def beta_pdf(x, a, b):
    return (x**(a-1) * (1-x)**(b-1) * math.gamma(a + b)
            / (math.gamma(a) * math.gamma(b)))


class UpdateDist(object):
    def __init__(self, ax, prob=0.5):
        self.success = 0
        self.prob = prob
        self.line, = ax.plot([], [], 'k-')
        self.x = np.linspace(0, 1, 200)
        self.ax = ax

        # Set up plot parameters
        self.ax.set_xlim(0, 1)
        self.ax.set_ylim(0, 15)
        self.ax.grid(True)

        # This vertical line represents the theoretical value, to
        # which the plotted distribution should converge.
        self.ax.axvline(prob, linestyle='--', color='black')

    def init(self):
        self.success = 0
        self.line.set_data([], [])
        return self.line,

    def __call__(self, i):
        # This way the plot can continuously run and we just keep
        # watching new realizations of the process
        if i == 0:
            return self.init()

        # Choose success based on exceed a threshold with a uniform pick
        if np.random.rand(1,) < self.prob:
            self.success += 1
        y = beta_pdf(self.x, self.success + 1, (i - self.success) + 1)
        self.line.set_data(self.x, y)
        return self.line,

# Fixing random state for reproducibility
np.random.seed(19680801)
fig, ax = plt.subplots()
ud = UpdateDist(ax, prob=0.7)
anim = FuncAnimation(fig, ud, frames=np.arange(100), init_func=ud.init, interval=5, blit=True)
plt.show()

