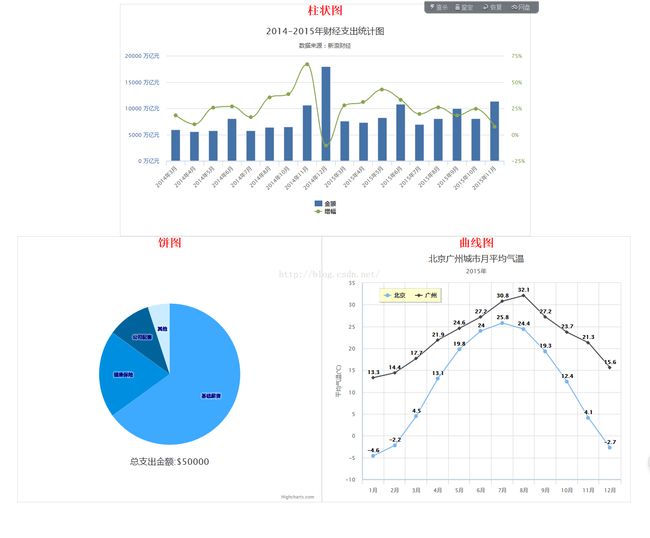
用Highcharts 框架做简单的柱状图、饼图、折线图
Highcharts相关文件下载:http://download.csdn.net/detail/richard_jason/9662405
效果图:
文件结构:
只是个简单的图,数据都是写进去的(可以动态提取)
首先是HTML代码:
饼图
曲线图
-----------------------------------------------------------------------------------------------------
CSS样式表代码:
@charset "utf-8";
/* CSS Document */
/*样式表*/
.demo{width:850px; height:420px; margin:10px auto;}
#header{border: 1px #E0E0E0 solid;width:850px; height:480px;margin: auto}
#main .top_title{margin:auto;text-align:center;color:#F00;}
#pie_chart{border: 0px #FF0000 solid;width:620px; height:520px;margin: auto;}
#main_bing{border: 1px #E0E0E0 solid;width:630px; height:550px;margin: auto;margin-top:0px;float:left;}
#main_bing .top_title_bing{margin:auto;text-align:center;color:#F00;}
#chart_line{border: 0px #FF0000 solid;width:620px; height:520px;margin: auto;}
#main_graph{border: 1px #E0E0E0 solid;width:50%; height:550px;margin: auto;margin-top:0px;float:left;}
#main_graph .top_title_graph{margin:auto;text-align:center;color:#F00;}
#buttom{margin:auto;border:0px #009933 solid;width:96%; height:560px;}
#zong{border:0px #FF0000 solid;width:1330px;height:1100px;margin:auto;}
-----------------------------------------------------------------------------------------------------------------------------------------------------------
JS 代码:
首先导入highcharts.js和jquery.js
最好先倒入jquery.js
柱状图:
// JavaScript Document
//柱状图
var chart;
$(function() {
chart = new Highcharts.Chart({
chart: {
renderTo: 'chart_column', //图表放置的容器,关联DIV#id
zoomType: 'xy' //X、Y轴均可放大
//因为是柱状图和曲线图共存在一个图表中,所以默认图表类型不在这里设置。
},
title: {
text: '2014-2015年财经支出统计图' //图表标题
},
subtitle: {
text: '数据来源:新浪财经' //图表副标题
},
credits: {
enabled: false //不显示LOGO
},
xAxis: [{ //X轴标签
categories: ['2014年3月', '2014年4月', '2014年5月', '2014年6月', '2014年7月',
'2014年8月', '2014年10月', '2014年11月', '2014年12月', '2015年3月', '2015年4月', '2015年5月',
'2015年6月', '2015年7月', '2015年8月', '2015年9月', '2015年10月', '2015年11月'],
labels: {
rotation: -45, //逆时针旋转45°,标签名称太长。
align: 'right' //设置右对齐
}
}],
yAxis: [{ //设置Y轴-第一个(增幅)
labels: {
formatter: function() { //格式化标签名称
return this.value + '%';
},
style: {
color: '#89A54E' //设置标签颜色
}
},
title: {text: ''}, //Y轴标题设为空
opposite: true //显示在Y轴右侧,通常为false时,左边显示Y轴,下边显示X轴
},
{ //设置Y轴-第二个(金额)
gridLineWidth: 0, //设置网格宽度为0,因为第一个Y轴默认了网格宽度为1
title: {text: ''},//Y轴标题设为空
labels: {
formatter: function() {//格式化标签名称
return this.value + ' 万亿元';
},
style: {
color: '#4572A7' //设置标签颜色
}
}
}],
tooltip: { //鼠标滑向数据区显示的提示框
formatter: function() { //格式化提示框信息
var unit = {
'金额': '亿元',
'增幅': '%'
} [this.series.name];
return '' + this.x + ': ' + this.y + ' ' + unit;
}
},
legend: { //设置图例
layout: 'vertical', //水平排列图例
shadow: true, //设置阴影
},
series: [{ //数据列
name: '金额',
color: '#4572A7',
type: 'column', //类型:纵向柱状图
yAxis: 1, //数据列关联到Y轴,默认是0,设置为1表示关联上述第二个Y轴即金额
data: [5923.95, 5575.55, 5786.7, 8119.15, 5810.87, 6413.69, 6488.3, 10599.64,
17982, 7570, 7304.45, 8268, 10809.12, 6949.92, 8076.92, 10018.55, 8079.03, 11396.18] //金额数据
},
{
name: '增幅',
color: '#89A54E',
type: 'spline', //类型:曲线图
data: [18.3, 9.8, 25.6, 26.8, 16.6, 35.4, 38.5, 66.9, -10.4, 27.8, 31.0, 42.9,
33.1, 19.6, 25.9, 18.3, 24.5,7.5] //增幅数据
}]
});
});
折线图:
// JavaScript Document
//曲线图
var chart1;
$(function() {
chart = new Highcharts.Chart({
chart: {
renderTo: 'chart_line', //图表放置的容器,DIV
defaultSeriesType: 'line', //图表类型line(折线图),
zoomType: 'x' //x轴方向可以缩放
},
credits: {
enabled: false //右下角不显示LOGO
},
title: {
text: '北京广州城市月平均气温' //图表标题
},
subtitle: {
text: '2015年' //副标题
},
xAxis: { //x轴
categories: ['1月', '2月', '3月', '4月', '5月', '6月', '7月', '8月', '9月', '10月',
'11月', '12月'], //x轴标签名称
gridLineWidth: 1, //设置网格宽度为1
lineWidth: 2, //基线宽度
labels:{y:26} //x轴标签位置:距X轴下方26像素
},
yAxis: { //y轴
title: {text: '平均气温(°C)'}, //标题
lineWidth: 2 //基线宽度
},
plotOptions:{ //设置数据点
line:{
dataLabels:{
enabled:true //在数据点上显示对应的数据值
},
enableMouseTracking: false //取消鼠标滑向触发提示框
}
},
legend: { //图例
layout: 'horizontal', //图例显示的样式:水平(horizontal)/垂直(vertical)
backgroundColor: '#ffc', //图例背景色
align: 'left', //图例水平对齐方式
verticalAlign: 'top', //图例垂直对齐方式
x: 100, //相对X位移
y: 70, //相对Y位移
floating: true, //设置可浮动
shadow: true //设置阴影
},
exporting: {
enabled: false //设置导出按钮不可用
},
series: [{ //数据列
name: '北京',
data: [ - 4.6, -2.2, 4.5, 13.1, 19.8, 24.0, 25.8, 24.4, 19.3, 12.4, 4.1, -2.7]
},
{
name: '广州',
data: [13.3, 14.4, 17.7, 21.9, 24.6, 27.2, 30.8, 32.1, 27.2, 23.7, 21.3, 15.6]
}]
});
});
最后是饼图:
// JavaScript Document
//饼图
$(function () {
var chart;
var totalMoney=50000
$(document).ready(function() {
chart = new Highcharts.Chart({
chart: {
renderTo: 'pie_chart',
plotBackgroundColor: 'white',//背景颜色
plotBorderWidth: 0,
plotShadow: false
},
title: {
text: '总支出金额:$'+totalMoney, //总金额
verticalAlign:'bottom',
y:-60
},
tooltip: {//鼠标移动到每个饼图显示的内容
pointFormat: '{point.name}: {point.percentage}%',
percentageDecimals: 1,
formatter: function() {
return this.point.name+':$'+totalMoney*this.point.percentage/100;
}
},
plotOptions: {
pie: {
size:'60%',
borderWidth: 0,
allowPointSelect: true,
cursor: 'pointer',
dataLabels: {
enabled: true,
color: '#000',
distance: -50,//通过设置这个属性,将每个小饼图的显示名称和每个饼图重叠
style: {
fontSize: '10px',
lineHeight: '10px'
},
formatter: function(index) {
return '' + this.point.name + '';
}
},
padding:20
}
},
series: [{//设置每小个饼图的颜色、名称、百分比
type: 'pie',
name: null,
data: [
{name:'基础薪资',color:'#3DA9FF',y:65},
{name:'健康保险',color:'#008FE0',y:20},
{name:'公司配套',color:'#00639B',y:10},
{name:'其他',color:'#CBECFF',y:5}
]
}]
});
});
});
END


