数据可视化学习记录
数据可视化学习记录
(1)

指定了一些点后,plot()会绘制出他认为合理的图形,可以看到,4.0处的值为25,但实际上应该是5.0处的值为25,我们需要为plot函数提供输入值来修正,
input_values = [1,2,3,4,5]
squares = [1, 4, 9, 16, 25]
plt.plot(input_values, squares, linewidth=5) #线粗细
(2)

设置plt.scatter中的c和cmap来实现颜色映射,数值小的颜色浅,数值大的颜色深。
(3)
randomwalk.py
from random import choice

class RandomWalk():
    """生成随机漫步数据的类"""
    def __init__(self, num_point=5000):
        self.num_point = num_point
        self.x_values = [0]
        self.y_values = [0]

    def fill_walk(self):
        while len(self.x_values) < self.num_point:
            x_direction = choice([1, -1])
            x_distance = choice([0, 1, 2, 3, 4])
            x_step = x_direction * x_distance

            y_direction = choice([1, -1])
            y_distance = choice([0, 1, 2, 3, 4])
            y_step = y_direction * y_distance
            #不要原地踏步
            if x_step == 0 and y_step ==0:
                continue

            #计算下一个点的x和y的值
            next_x = self.x_values[-1] + x_step #将新的步数与x_values中的最后一个数相加
            next_y = self.y_values[-1] + y_step

            self.x_values.append(next_x)
            self.y_values.append(next_y)
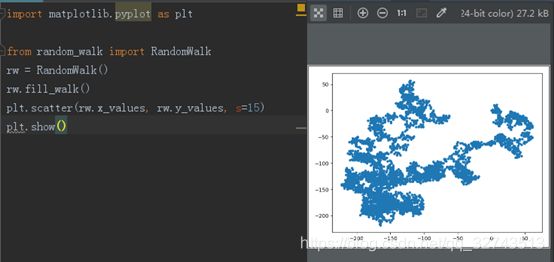
(4)
from die import Die
import pygal
die = Die()

results = []
for roll_num in range(1000):
    result = die.roll()
    results.append(result)

# 分析结果
frequencies = []
for value in range(1, die.num_sides+1):
    frequencie = results.count(value)
    frequencies.append(frequencie)
hist = pygal.Bar()
hist.title = "results of rolling one D6 1000 times"
hist.x_labels = ['1','2','3','4','5','6']
hist.x_title = "Result"
hist.y_title = "Frequency of Result"

hist.add('D6',frequencies)
hist.render_to_file('die_visual3.svg')

print(frequencies)

enumerate()是python的内置函数
enumerate在字典上是枚举、列举的意思
对于一个可迭代的(iterable)/可遍历的对象(如列表、字符串),enumerate将其组成一个索引序列,利用它可以同时获得索引和值
enumerate多用于在for循环中得到计数
例如对于一个seq,得到:
(0, seq[0]), (1, seq[1]), (2, seq[2])
(5)
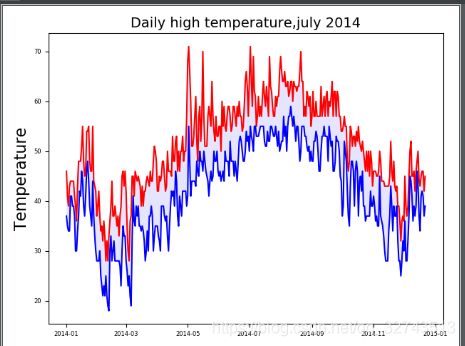
import csv
from matplotlib import pyplot as plt
from datetime import datetime
filename = 'sitka_weather_2014.csv'
with open(filename) as f:
    reader = csv.reader(f)
    header_row = next(reader)

    dates = []
    highs = []
    lows = []
    for row in reader:
        current_date = datetime.strptime(row[0],"%Y-%m-%d")
        dates.append(current_date)
        high = int(row[1])
        highs.append(high)
        low = int(row[3])
        lows.append(low)
plt.plot(dates,highs, c='red')
plt.plot(dates,lows, c='blue')
plt.fill_between(dates,highs,lows,facecolor='blue',alpha=0.1)
#设置图形的格式
plt.title("Daily high temperature,july 2014", fontsize=14)
plt.xlabel('',fontsize=16)
plt.ylabel("Temperature", fontsize=16)
plt.tick_params(axis='both', which='major', labelsize=6)

plt.show()
(6)
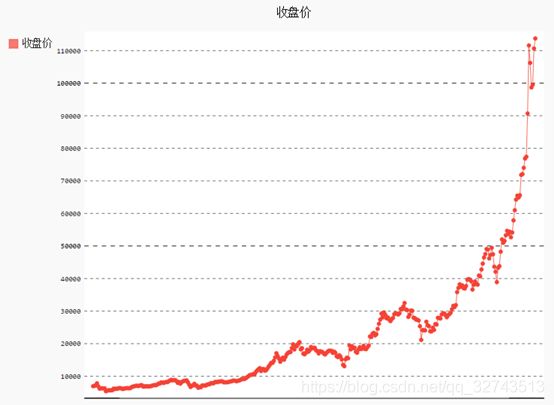
import json
import pygal
filename = 'btc_close_2017.json'
with open(filename) as f:
    btc_data = json.load(f)
print(btc_data)
for btc_dict in btc_data:
    date = btc_dict["date"]
    month = int(btc_dict['month'])
    week = int(btc_dict['week'])
    weekday = btc_dict['weekday']
    close = int(float(btc_dict['close']))
    print("{}is month{}week,{},{},the close price is{}rmb".format(date,month,week,weekday,close))

dates = []
months = []
weeks = []
weekdays = []
close = []
for btc_dict in btc_data:
    dates.append(btc_dict['date'])
    months.append(int(btc_dict['month']))
    weeks.append(int(btc_dict['week']))
    weekdays.append(btc_dict['weekday'])
    close.append(int(float(btc_dict['close'])))

line_chart = pygal.Line(x_label_rotation=20, show_minor_x_labels = False)
line_chart.title = '收盘价'
line_chart.x_labels = dates
N=20
line_chart._x_labels_major = dates[::N]
line_chart.add('收盘价', close)
line_chart.render_to_file('收盘价折线图.svg')
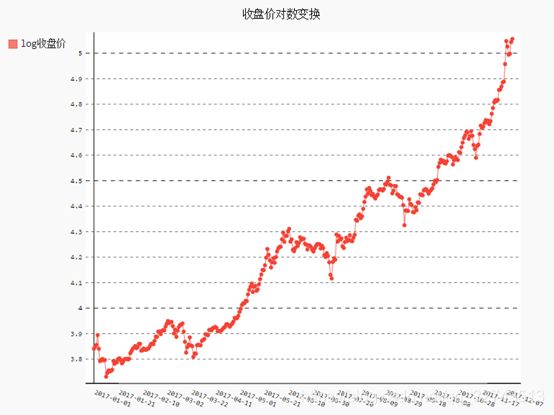
close_log = [math.log10(_) for _ in close]
以下实例展示了 zip 的使用方法:
a = [1,2,3]
b = [4,5,6]
c = [4,5,6,7,8]
zipped = zip(a,b) # 打包为元组的列表
[(1, 4), (2, 5), (3, 6)]zip(a,c) # 元素个数与最短的列表一致
[(1, 4), (2, 5), (3, 6)]zip(*zipped) # 与 zip 相反,*zipped 可理解为解压,返回二维矩阵式
[(1, 2, 3), (4, 5, 6)]
Groupby:
01
(‘01’, ‘5383.0598’)
(‘01’, ‘5566.7345’)
(‘01’, ‘5648.6897’)
(‘01’, ‘5674.7977’)
(‘01’, ‘5700.0716’)
(‘01’, ‘5730.0658’)
(‘01’, ‘6047.6601’)
…
02
(‘02’, ‘6793.7077’)
(‘02’, ‘6811.6794’)
(‘02’, ‘6833.4884’)
(‘02’, ‘6858.5789’)
(‘02’, ‘6883.9424’)
(‘02’, ‘6930.882’)
(‘02’, ‘6934.3856’)
(‘02’, ‘6935.3788’)
…
03
(‘03’, ‘6437.3431’)
(‘03’, ‘6623.5896’)
(‘03’, ‘6640.554’)
(‘03’, ‘6694.36’)
(‘03’, ‘7028.0107’)
(‘03’, ‘7092.2246’)
(‘03’, ‘7139.7016’)
(‘03’, ‘7146.3119’)
…
(7)
import json
import pygal
import math
from itertools import groupby
filename = 'btc_close_2017.json'
with open(filename) as f:
    btc_data = json.load(f)

dates = []
months = []
weeks = []
weekdays = []
close = []
for btc_dict in btc_data:
    dates.append(btc_dict['date'])
    months.append(btc_dict['month'])
    weeks.append(int(btc_dict['week']))
    weekdays.append(btc_dict['weekday'])
    close.append(int(float(btc_dict['close'])))


def draw_line(x_data,y_data,title,y_legend):
    xy_map = []
    for x,y in groupby(sorted(zip(x_data,y_data)), key=lambda _:_[0]):
        y_list = [v for _, v in y]
        print(y_list)
        xy_map.append([x, sum(y_list)/len(y_list)])
        print(xy_map)

    x_unique, y_mean = [*zip(*xy_map)]
    print(x_unique,y_mean)
    line_chart = pygal.Line()
    line_chart.title = title
    line_chart.x_labels = x_unique
    line_chart.add(y_legend, y_mean)
    line_chart.render_to_file(title+'.svg')

    return line_chart

idx_month = dates.index('2017-12-01')
draw_line(months[:idx_month], close[:idx_month], '收盘价月日均值', '月日均值')

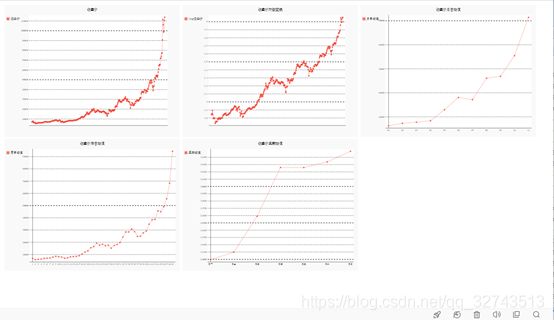
with open('收盘价Dashboard.html','w',encoding='utf8') as html_file:
html_file.write('收盘价Dashboard \n')
for svg in [
'收盘价折线图.svg', '收盘价对数变换折线图.svg', '收盘价月日均值.svg',
'收盘价周日均值.svg', '收盘价星期均值.svg'
]:
html_file.write('\n '.format(svg))
html_file.write('')