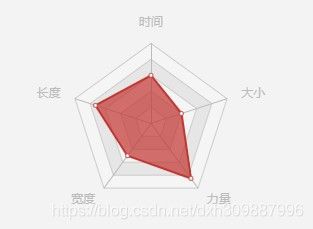
react中使用Echarts图表类工具构建雷达图
react中使用Echarts图表类工具构建雷达图
- 前言
- 使用
- 1. 在项目中引入Echarts
- 2. 使用ReactEcharts创建图表
前言
ECharts,一个使用 JavaScript 实现的开源可视化库,可以流畅的运行在 PC 和移动设备上,兼容当前绝大部分浏览器(IE8/9/10/11,Chrome,Firefox,Safari等),底层依赖矢量图形库 ZRender,提供直观,交互丰富,可高度个性化定制的数据可视化图表。它提供了常规的折线图、柱状图、散点图、饼图、K线图,用于统计的盒形图,用于地理数据可视化的地图、热力图、线图,用于关系数据可视化的关系图、treemap、旭日图,多维数据可视化的平行坐标,还有用于 BI 的漏斗图,仪表盘,并且支持图与图之间的混搭
使用
1. 在项目中引入Echarts
1.1 import ReactEcharts from "echarts-for-react";
1.2 import echarts from 'echarts';
2. 使用ReactEcharts创建图表
2.1 由于项目需要,所以我直接把这个雷达图封装成了一个组件,具体代码如下
class EchartsRadar extends Component {
constructor(props) {
super(props);
this.state = {};
// this.indicator = []
}
// 把一些参数封装成一个函数在下面组件调用
getOption() {
let { item, color } = this.props
// 这里是通过props把参数传进来,并且进行判断
if (!item) {
return ''
}
return {
title: {
text: ''
},
color: color, // 这是一个雷达图渲染的线的颜色
//点击提示标签
// tooltip: {},
legend: {
//图例显示在底部
bottom: 0,
//图例背景颜色
backgroundColor: "transparent",
// 图例标记的图形宽度。[ default: 25 ]
itemWidth: 12,
// 图例标记的图形高度。[ default: 14 ]
itemHeight: 9,
//图例文字样式设置
textStyle: mytextStyle
},
radar: {
//雷达图绘制类型,支持 'polygon' 和 'circle' [ default: 'polygon' ]
// shape: 'polygon',
splitNumber: 3,
center: ['50%', '50%'],
radius: '65%',
//指示器名称和指示器轴的距离。[ default: 15 ]
nameGap: 3,
triggerEvent: true,
name: {
//这是一个文字的样式
textStyle: {
color: '#999',
backgroundColor: 'transparent'
// borderRadius: 3,
// padding: [3, 5]
},
b: {
color: "#333",
fontSize: 10,
align: "center"
}
}
},
// 这是雷达图展示的每个点的数据
indicator: [
{ name: "时间", value: item.rom, max: 100 },
{ name: "长度", value: item.accuracy, max: 100 },
{ name: "宽度", value: item.coordination, max: 100 },
{ name: "力量", alue: item.strength, max: 100 },
{ name: "大小", value: item.endurance, max: 100 }
],
// center: ['50%'],
//雷达图背景的颜色,在这儿随便设置了一个颜色,完全不透明度为0,就实现了透明背景
splitArea: {
show: false,
areaStyle: {
color: "rgba(255,0,0,0)" // 图表背景的颜色
}
},
series: [{
type: "radar",
//显示雷达图选中背景
// data中的对象就是雷达图中的每一组数据,若是只有一组数据默认雷达图的线数据只有一条
data: [{ value: [item.rom, item.accuracy, item.coordination, item.strength, item.endurance], areaStyle: { opacity: 0.7, color: color, offset: 1 } }],// 里面的颜色也是传递进来的color
id: "one"
}]
};
};
render() {
let onEvents = {
'click': this.onChartClick.bind(this),
'legendselectchanged': this.onChartLegendselectchanged.bind(this)
};
return (
