GEO数据挖掘-从数据下载到富集分析-各种绘图(学习笔记)
###############################
##---------GEO-data1---------##
###############################
rm(list = ls())
source("http://bioconductor.org/biocLite.R") #before install package
biocLite('DOSE') #bioconductor软件安装示例

## 1.下载GSE数据,获得表达量矩阵
{
  suppressPackageStartupMessages(library(GEOquery))
  gset <- getGEO('GSE42872',destdir = ".",
                 AnnotGPL = F,
                 getGPL = F)#下载GSE数据
  save(gset,file = 'GSE42872.gset.Rdata')
  exprSet <- read.table(file = 'GSE42872_series_matrix.txt.gz',
                        sep = '\t',
                        header = T,
                        quote = '',
                        fill = T,
                        comment.char = "!") #读取表达数据
  rownames(exprSet) = exprSet[,1] #将第一列作为行名
  exprSet <- exprSet[,-1] #去掉第一列

}
 ## 2.ID translation
  View(gset) #查看对应芯片平台,“ GPL6244”,去生信菜鸟团找
  suppressPackageStartupMessages(library(hugene10sttranscriptcluster.db))
  ids = toTable(hugene10sttranscriptclusterSYMBOL)
  length(unique(ids$symbol))
  tail(sort(table(ids$symbol)))
  table(sort(table(ids$symbol)))
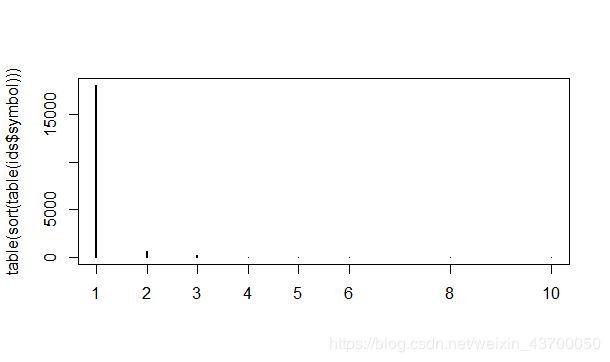
  plot(table(sort(table(ids$symbol))))
  table(rownames(exprSet) %in% ids$probe_id)
  exprSet = exprSet[rownames(exprSet) %in% ids$probe_id,]#初次筛选芯片
  head(ids)
  head(exprSet)


  #exprSet[ids[,2] == 'IGKC',] #一个基因有10个芯片,需要再次过滤
  #x = exprSet[ids[,2] == 'IGKC',]
  #which.max(rowMeans(x))#这10个芯片在所有样本中都有均值,取均值最大的芯片


  tmp = by(exprSet,
           ids$symbol,
           function(x) rownames(x)[which.max(rowMeans(x))])
  probes = as.character(tmp)
  exprSet = exprSet[rownames(exprSet) %in% probes,] #迭代,再次过滤

  ids = ids[match(rownames(exprSet),ids$probe_id),]
  rownames(exprSet) <- ids$symbol
  exprSet1 = exprSet
  save(exprSet1,file = 'exprSet_GSE42872_id_trans.Rdata')
## 3.表达矩阵的了解
  library(reshape2)
  library('ggplot2')
  b = gset[[1]]
  tmp = pData(b)
  group_list = c(rep('control',3),rep('case',3))
  exprSet_L = melt(exprSet1)
  colnames(exprSet_L) = c('sample','value')
  exprSet_L$group = rep(group_list,each = nrow(exprSet1))

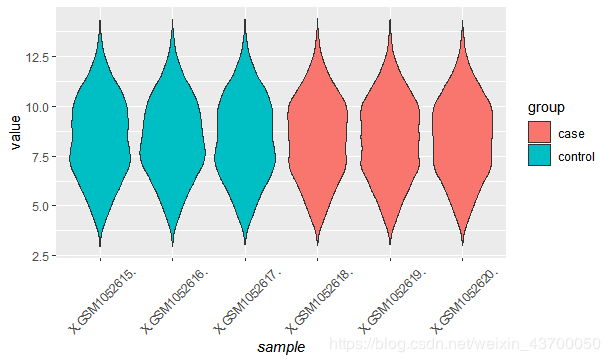
  ##小提琴图
  p1 = ggplot(exprSet_L,aes(x = sample, y = value,fill = group)) +geom_violin()
  print(p1)
 ##箱线图
 p2 = ggplot(exprSet_L,aes(x = sample, y = value,fill = group)) +geom_boxplot()+
    theme(axis.title.x  = element_text(face = 'italic'),
          axis.text.x =  element_text(angle = 45 , vjust = 0.5))
  print(p2)
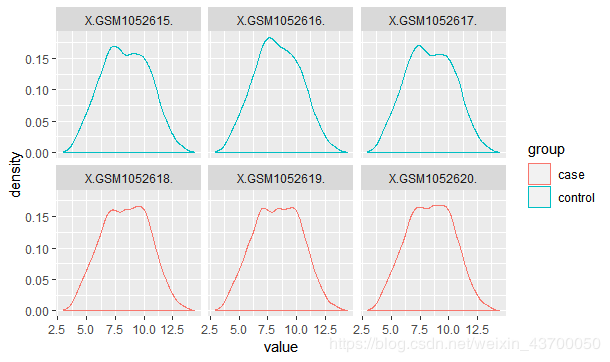
##密度图
  p3 = ggplot(exprSet_L,aes(value,col=group)) +geom_density() +
    facet_wrap(~sample,nrow = 2)
  print(p3)
##hclust
  colnames(exprSet1) = paste(group_list,1:6,sep = '') ##样本名称再次改变

  nodepar = list(lab.cex = 0.6, pch = c(NA,19),
                 cex = 0.7,col = 'blue')
  hc=hclust(dist(t(exprSet1)))
  par(mar=c(5,5,5,10))
  png(filename = 'hclust.png')
  plot(as.dendrogram(hc),nodepar = nodepar, hariz = T)
  dev.off()
##主成分分析
  library(ggfortify)
  df = as.data.frame(t(exprSet1))
  df$group = group_list
  p5 = autoplot(prcomp(df[,1:(ncol(df)-1)]),
                data = df,colour = 'group')
  print(p5)
## 4.差异表达
  library(limma)
  group_list
  design <- model.matrix(~0+factor(group_list))
  colnames(design) = levels(factor(group_list))
  rownames(design) = colnames(exprSet1)
  contrast.matrix <- makeContrasts(paste0(unique(group_list),collapse = '-'),
   levels =design)
  contrast.matrix[1,1] = 1 #control和case设置反了
  contrast.matrix[2,1] = -1
  ##step1
  fit <- lmFit(exprSet1,design)
  ##step2
  fit2 <- contrasts.fit(fit,contrast.matrix)
  fit2 <- eBayes(fit2)
  ##step3
  tempOutput <- topTable(fit2, coef =1, n = Inf)
  nrDEG = na.omit(tempOutput)
  head(nrDEG)
  save(nrDEG,file = 'nrDEG.Rdata')
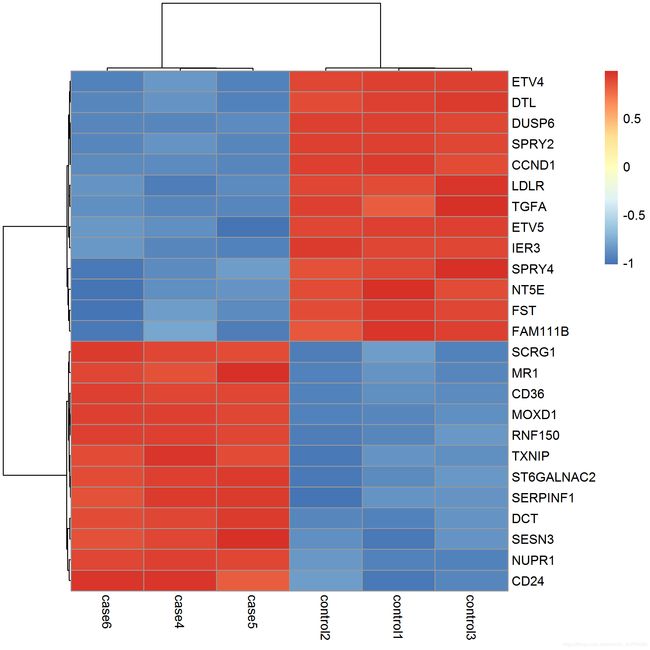
  library(pheatmap)
  choose_gene = head(rownames(nrDEG),25)
  choose_matrix = exprSet1[choose_gene,]
  choose_matrix = t(scale(t(choose_matrix)))
  p = pheatmap(choose_matrix,filename = 'DEG_top25_heatmap.png')
## 5.火山图
  logFC_cutoff = with(nrDEG,mean(abs(logFC))+2*sd(abs(logFC)))
  nrDEG$change = as.factor(ifelse(nrDEG$P.Value < 0.05 &
                                    abs(nrDEG$logFC) > logFC_cutoff,
                                  ifelse(nrDEG$logFC > logFC_cutoff,
                                         'UP','DOWN'),'NOT'))
  this_title = paste0('Cutoff for logFC is ',round(logFC_cutoff,2),
                      '\nThe number of up gene is ',nrow(nrDEG[nrDEG$change == 'UP',]),
                      '\nThe number of down gene is ',nrow(nrDEG[nrDEG$change == 'DOWN',]))
  library(ggplot2)
  g = ggplot(data = nrDEG,
             aes(x = logFC, y = -log10(P.Value),
                 color = change)) +
    geom_point(alpha = 0.4, size = 1.75) +
    theme_set(theme_set(theme_bw(base_size = 10))) +
    xlab("log2 fold change") + ylab('-log10 p-value') +
    ggtitle(this_title) +theme(plot.title = element_text(size = 10,hjust = 0.5)) +
    scale_color_manual(values = c('blue','black','red'))
  print(g)
  ggsave(g,filename = 'volcano.png')
## 6.富集分析 GO KEGG DO
  library(topGO)
  library(Rgraphviz)
  library(pathview)
  library(clusterProfiler)
  library(org.Hs.eg.db)
  library(DOSE)
  gene = rownames(nrDEG[nrDEG$P.Value < 0.05 & abs(nrDEG$logFC) > logFC_cutoff,])
  gene.df <- bitr(gene, fromType = 'SYMBOL',
                  toType = c('ENSEMBL','ENTREZID'),
                  OrgDb = org.Hs.eg.db)
  head(gene.df)
##6.1 KEGG pathway analysis

  kk <- enrichKEGG(gene = gene.df$ENTREZID,
                   organism = 'hsa',
                   pvalueCutoff = 0.05)
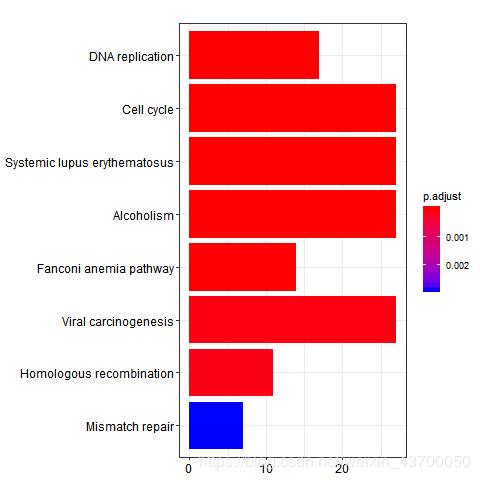
  png(filename ='kegg_barplot.png' )
  barplot(kk)
  dev.off()

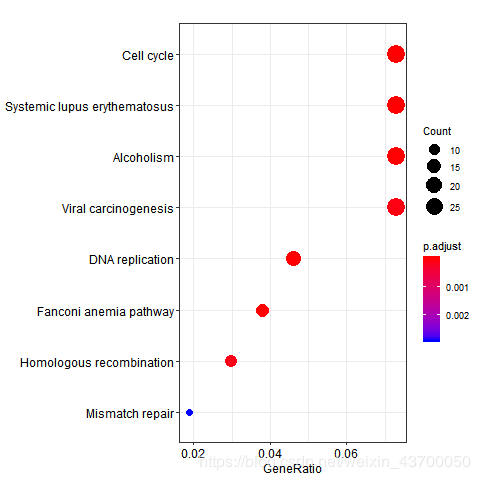
  png(filename ='kegg_dotplot.png' )
  dotplot(kk)
  dev.off()
##6.2 GO analysis

  columns(org.Hs.eg.db) #查看基因类型
enrich.go.BP = enrichGO(gene = gene.df$ENTREZID,
                          OrgDb = org.Hs.eg.db,
                          keyType = 'ENTREZID',
                          ont = 'BP',
                          pvalueCutoff = 0.01,
                          qvalueCutoff = 0.05,
                          readable = T)
  png(filename ='go_bp_barplot.png' )
  barplot(enrich.go.BP)
  dev.off()

  png(filename ='go_bp_dotplot.png' )
  dotplot(enrich.go.BP)
  dev.off()

  png(filename ='go_bp_plotGOgraph.png' )
  plotGOgraph(enrich.go.BP)
  dev.off()
  enrich.go.CC = enrichGO(gene = gene.df$ENTREZID,
                          OrgDb = org.Hs.eg.db,
                          keyType = 'ENTREZID',
                          ont = 'CC',
                          pvalueCutoff = 0.01,
                          qvalueCutoff = 0.05,
                          readable = T)
  png(filename ='go_cc_barplot.png' )
  barplot(enrich.go.CC)
  dev.off()

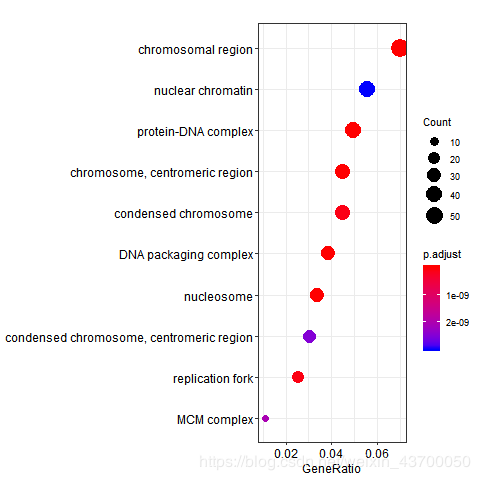
  png(filename ='go_cc_dotplot.png' )
  dotplot(enrich.go.CC)
  dev.off()

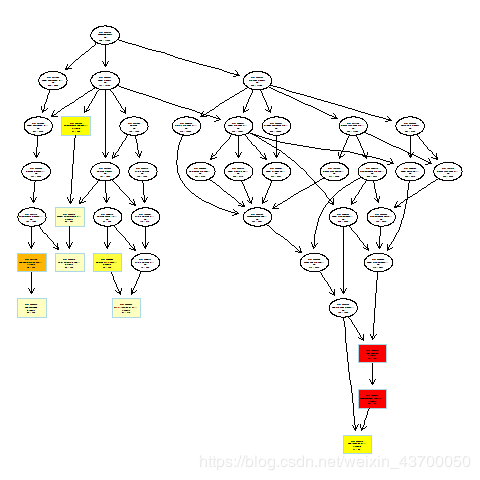
  png(filename ='go_cc_plotGOgraph.png' )
  plotGOgraph(enrich.go.CC)
  dev.off()
  enrich.go.MF = enrichGO(gene = gene.df$ENTREZID,
                          OrgDb = org.Hs.eg.db,
                          keyType = 'ENTREZID',
                          ont = 'MF',
                          pvalueCutoff = 0.01,
                          qvalueCutoff = 0.05,
                          readable = T)
  png(filename ='go_mf_barplot.png' )
  barplot(enrich.go.MF)
  dev.off()

  png(filename ='go_mf_dotplot.png' )
  dotplot(enrich.go.MF)
  dev.off()

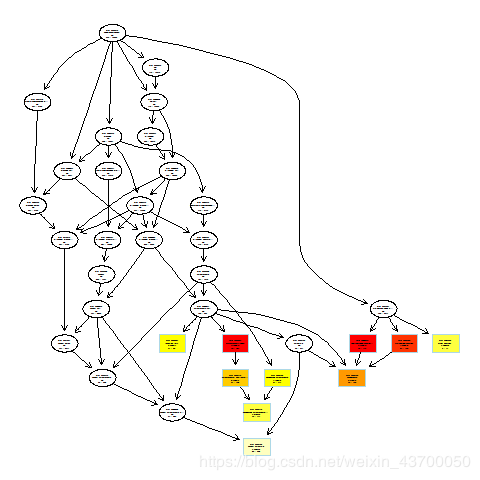
  png(filename ='go_mf_plotGOgraph.png' )
  plotGOgraph(enrich.go.MF)
  dev.off()

  pdf(file ='go_mf_plotGOgraph.pdf' )
  plotGOgraph(enrich.go.MF)
  dev.off()
##6.3 DO analysis

  enrich.do <- enrichDO(gene = gene.df$ENTREZID,
               ont = 'DO',
               pvalueCutoff = 0.05,
               pAdjustMethod = 'BH',
               minGSSize = 5,
               maxGSSize = 500,
               qvalueCutoff = 0.05,
               readable = F)
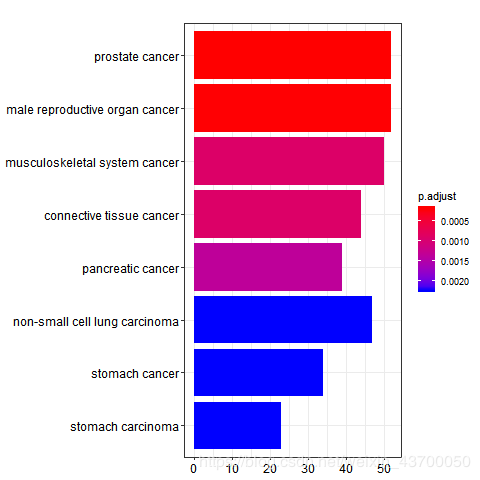
  png(filename ='do_barplot.png' )
  barplot(enrich.do)
  dev.off()

  png(filename ='do_dotplot.png' )
  dotplot(enrich.do)
  dev.off()

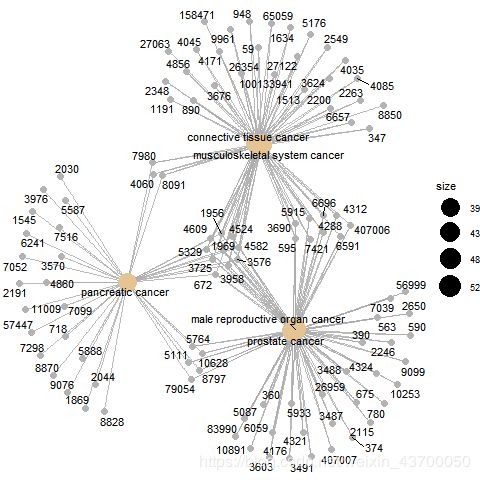
  pdf(file ='do_cnetplot.pdf' )
  cnetplot(enrich.do)
  dev.off()
本博客内容将同步更新到个人微信公众号:生信玩家。欢迎大家关注~~~
![]()
