python keras 各种激活函数对应的图像
激活函数
一、tanh 对应 python
# -*- coding: utf-8 -*-

import numpy as np
import matplotlib.pyplot as plt
from keras import backend as K

x = np.linspace(-3,3,100)
y = K.tanh(x)
plt.plot(x, y, 'b', label = "y = tanh (x)")
plt.legend()
plt.grid()
plt.show()
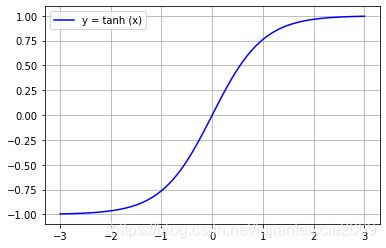
1.1 tanh 对应 算法
y = e 2 − e − x e 2 + e − x y=\frac{ e^{2}-e^{-x} }{ e^{2}+e^{-x} } y=e2+e−xe2−e−x
1.2 tanh 对应图像
二、relu 对应 python
# -*- coding: utf-8 -*-

import numpy as np
import matplotlib.pyplot as plt
from keras import backend as K

x = np.linspace(-1,1,100)
y = K.relu(x)
plt.plot(x, y, 'b', label = "y = relu (x)")
plt.legend()
plt.grid()
plt.show()
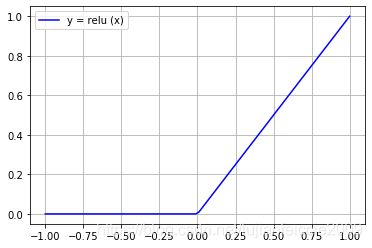
2.1 relu 对应 算法
y = m a x ( 0 , x ) y=max(0,x) y=max(0,x)
2.2 relu 对应图像
三、elu 对应 python
# -*- coding: utf-8 -*-

import numpy as np
import matplotlib.pyplot as plt
from keras import backend as K

x = np.linspace(-6,6,100)
y = K.elu(x)
plt.plot(x, y, 'b', label = "y = elu (x)")
plt.legend()
plt.grid()
plt.show()
3.1 elu 对应算法
y = m a x ( 0 , x ) + m i n ( 0 , α ∗ ( e x − 1 ) ) y=max(0,x) + min(0,\alpha * (e^{x} - 1)) y=max(0,x)+min(0,α∗(ex−1))
3.2 elu 对应图像
四、softmax 对应 python
# -*- coding: utf-8 -*-

import numpy as np
import matplotlib.pyplot as plt
from keras import backend as K

x = np.linspace(-4,4,100)
y = K.softmax(x)
plt.plot(x, y, 'b', label = "y = softmax (x)")
plt.legend()
plt.grid()
plt.show()
4.1 softmax 对应算法
softmax常用来进行多分类,假如有一个4x1向量 z [ L ] = [ 5 , 2 , − 1 , 3 ] z^{[L]}=[5,2,-1,3] z[L]=[5,2,−1,3],softmax的计算过程如下所示
z [ L ] = [ 5 2 − 1 3 ] z^{[L]} = \left[ \begin{matrix} 5\\ 2\\ -1\\ 3 \end{matrix} \right] z[L]=⎣⎢⎢⎡52−13⎦⎥⎥⎤
t = [ e 5 e 2 e − 1 e 3 ] t = \left[ \begin{matrix} e^{5}\\ e^{2}\\ e^{-1}\\ e^{3} \end{matrix} \right] t=⎣⎢⎢⎡e5e2e−1e3⎦⎥⎥⎤
输入向量 z [ L ] z^{[L]} z[L] 和中间向量 t t t
g [ L ] ( z [ L ] ) = [ e 5 / ( e 5 + e 2 + e − 1 + e 3 ) e 2 / ( e 5 + e 2 + e − 1 + e 3 ) e − 1 / ( e 5 + e 2 + e − 1 + e 3 ) e 3 / ( e 5 + e 2 + e − 1 + e 3 ) ] g^{[L]}(z^{[L]}) = \left[ \begin{matrix} e^{5}/(e^{5}+e^{2}+e^{-1}+e^{3})\\ e^{2}/(e^{5}+e^{2}+e^{-1}+e^{3})\\ e^{-1}/(e^{5}+e^{2}+e^{-1}+e^{3})\\ e^{3}/(e^{5}+e^{2}+e^{-1}+e^{3})\\ \end{matrix} \right] g[L](z[L])=⎣⎢⎢⎡e5/(e5+e2+e−1+e3)e2/(e5+e2+e−1+e3)e−1/(e5+e2+e−1+e3)e3/(e5+e2+e−1+e3)⎦⎥⎥⎤
y i j = e X i j ∑ j e ( X i j ) y_{ij}=\frac{ e^{X_{ij}} }{ \sum_j e^{(X_{ij})} } yij=∑je(Xij)eXij
4.2 softmax 对应图像
五、softplus 对应 python
# -*- coding: utf-8 -*-

import numpy as np
import matplotlib.pyplot as plt
from keras import backend as K

x = np.linspace(-6,6,100)
y = K.softplus(x)
plt.plot(x, y, 'b', label = "y = softplus (x)")
plt.legend()
plt.grid()
plt.show()
5.1 softplus 对应 算法
y = l n ( 1 + e x ) y=ln(1+e^{x}) y=ln(1+ex)
5.2 softplus 对应图像
六、softsign 对应 python
# -*- coding: utf-8 -*-

import numpy as np
import matplotlib.pyplot as plt
from keras import backend as K

x = np.linspace(-6,6,100)
y = K.softsign(x)
plt.plot(x, y, 'b', label = "y = softsign (x)")
plt.legend()
plt.grid()
plt.show()
6.1 softsign 对应 算法
y = x 1 + ∣ x ∣ y=\frac{ x }{ 1+|x| } y=1+∣x∣x
6.2 softsign 对应图像
七、sigmoid 对应 python
# -*- coding: utf-8 -*-

import numpy as np
import matplotlib.pyplot as plt
from keras import backend as K

x = np.linspace(-6,6,100)
y = K.sigmoid(x)
plt.plot(x, y, 'b', label = "y = sigmoid (x)")
plt.legend()
plt.grid()
plt.show()
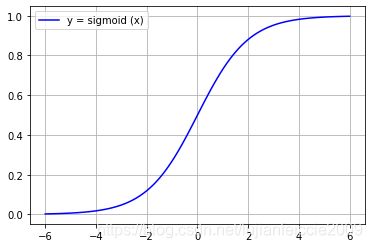
7.1 sigmoid 对应 算法
y = x 1 + e − x y=\frac{ x }{ 1+e^{-x} } y=1+e−xx
7.2 sigmoid 对应图像
八、hard_sigmoid 对应 python
# -*- coding: utf-8 -*-

import numpy as np
import matplotlib.pyplot as plt
from keras import backend as K

x = np.linspace(-4,4,100)
x = K.constant(x)
y = K.hard_sigmoid(x)
plt.plot(x, y, 'b', label = "y = hard_sigmoid (x)")
plt.legend()
plt.grid()
plt.show()
8.1 hard_sigmoid 对应算法
如果 x < -2.5,返回 0。
如果 x > 2.5,返回 1。
如果 -2.5 <= x <= 2.5,返回 0.2 * x + 0.5。
8.2 hard_sigmoid 对应图像
九、linear
# -*- coding: utf-8 -*-

import numpy as np
import matplotlib.pyplot as plt
from keras import backend as K

x = np.linspace(-6,6,100)
y = x
plt.plot(x, y, 'b', label = "y = linear (x)")
plt.legend()
plt.grid()
plt.show()
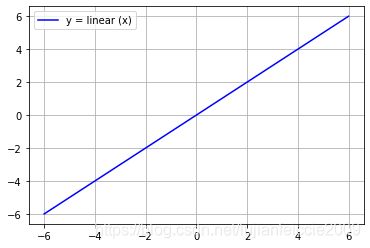
9.1 linear 对应算法
y = x y=x y=x


