Echarts动态加载折线图 x轴,y轴数据,阴影部分
需求
具体实现
- 安装echarts
npm install echarts -S - 引入echarts
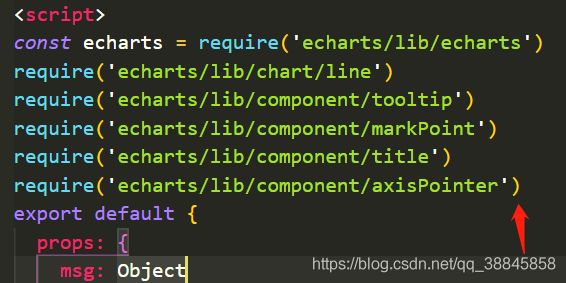
为了节省空间,这里采用按需引用
const echarts = require('echarts/lib/echarts')
require('echarts/lib/chart/line')
require('echarts/lib/component/tooltip')
require('echarts/lib/component/markPoint')
require('echarts/lib/component/title')
require('echarts/lib/component/axisPointer')
- 创建容器
<div id="myChart" :style="{width: '110%', height: '200px', top: '-8%', left: '-4%', position: 'absolute', zIndex: 20}"></div>
注意: 想要改变echarts的位置,大小,可以在行内写样式,id对应的是图标的表示
- 创建js
//   图表
    drawLine () {
      // 基于准备好的dom,初始化echarts实例
      const myChart = echarts.init(document.getElementById('myChart'))
      // 绘制图表
      myChart.setOption({
        tooltip: {
          // 设置tip提示
          trigger: 'axis',
          backgroundColor: '#0dcba3' // 背景颜色(此时为默认色)
        },
        color: '#8AE09F', // 设置区分(每条线是什么颜色,和 legend 一一对应)
        xAxis: {
          // 配置x轴数据、样式、名称
          type: 'category',
          boundaryGap: false, // 坐标轴两边不留白
          data: this.MomDay,
          axisLine: {
            // 坐标轴轴线相关设置。
            lineStyle: {
              color: '#0dcba3'
            }
          }
        },
        yAxis: [{
          type: 'value',
          scale: true,
          max: this.max + 3,
          min: 0,
          splitNumber: 5,
          axisLine: {
            // 坐标轴轴线相关设置。
            lineStyle: {
              color: '#0dcba3'
            }
          }
        }],
        // 刻度线
        axisTick: {
          show: false,
          alignWithLabel: true
        },
        series: [
          {
            name: '交易数',
            data: this.showData,
            type: 'line', // 类型为折线图
            smooth: true, // 曲线平滑
            itemStyle: {
              normal: {
                areaStyle: {
                  z: 10,
                  type: 'default',
                  // 渐变色实现
                  color: new echarts.graphic.LinearGradient(
                    0,
                    0,
                    0,
                    1,
                    // 变化度
                    // 三种由深及浅的颜色
                    [
                      {
                        offset: 0,
                        color: '#0dcba3'
                      },
                      //   {
                      //   offset: 0.5,
                      //   color: '#FFFFFF',
                      // },
                      {
                        offset: 1,
                        color: '#FFFFFF'
                      }
                    ]
                  )
                },
                lineStyle: {
                  // 线的颜色
                  width: 1,
                  type: 'solid',
                  color: '#0dcba3'
                },
                label: {
                  show: false,
                  position: 'top',
                  textStyle: {
                    color: '#0dcba3'
                  }
                },
                color: '#FFFFFF',
                borderColor: '#0dcba3',
                borderWidth: 1
              }
            }
          }
        ]
      })
    },
注意:这里drawLine() 调用的时机
由于echarts的数据是根据后端返回的数据进行填充,所以drawLine()的调用时机,我是放在了请求完图表相关数据,调用drawLine()
- x轴最近14天的数据动态填写
xAxis: {
          // 配置x轴数据、样式、名称
          type: 'category',
          boundaryGap: false, // 坐标轴两边不留白
          data: this.MomDay,
          axisLine: {
            // 坐标轴轴线相关设置。
            lineStyle: {
              color: '#0dcba3'
            }
          }
        },
data: this.MomDay 是自己或许到的最近14天的天数
数据传递,和以前一样
- 先在data里声明变量 MomDay: []
- 然后对MomDay 进行赋值
- 将MomDay 传递给折线图的data
- 注意:echarts的宽度如果不够,x轴会显示最近十四天的天数,但是中间会间隔一个,显示一个日期。如果宽度充足,会全部显示14天的日期
- 下面会给出获取最近14天数的代码
- y轴根据x轴日期所对应的数据,动态显示数据所在区间
yAxis: [{
          type: 'value',
          scale: true,
          max: this.max + 3,
          // max 是后端返回的数据,表示最大值。知道最大值,间隔数,动态显示y轴数据就很方便了. + 3的意思是,不至于图表顶到最顶部,给顶部稍微留点间隔
          // 比如 max =  12 splitNumber: 5 那每个间隔值就是 2 ... 2
          max =  15 splitNumber: 5 那每个间隔值就是 3
          min: 0,
          splitNumber: 5, // y轴的间隔数
          axisLine: {
            // 坐标轴轴线相关设置。
            lineStyle: {
              color: '#0dcba3'
            }
          }
        }],
- 鼠标移入,显示日期对应的数据
- 所有有数据的地方,用折线连接,并且用阴影覆盖
series: [
          {
            name: '交易数',
            data: this.showData,
            type: 'line', // 类型为折线图
            smooth: true, // 曲线平滑
            itemStyle: { // 阴影覆盖
              normal: {
                areaStyle: {
                  z: 10,
                  type: 'default',
                  // 渐变色实现
                  color: new echarts.graphic.LinearGradient(
                    0,
                    0,
                    0,
                    1,
                    // 变化度
                    // 三种由深及浅的颜色
                    [
                      {
                        offset: 0,
                        color: '#0dcba3'
                      },
                      //   {
                      //   offset: 0.5,
                      //   color: '#FFFFFF',
                      // },
                      {
                        offset: 1,
                        color: '#FFFFFF'
                      }
                    ]
                  )
                },
                lineStyle: {
                  // 线的颜色
                  width: 1,
                  type: 'solid',
                  color: '#0dcba3'
                },
                label: {
                  show: false,
                  position: 'top',
                  textStyle: {
                    color: '#0dcba3'
                  }
                },
                color: '#FFFFFF',
                borderColor: '#0dcba3',
                borderWidth: 1
              }
            }
          }
        ]
注意 鼠标移入,还是接口数据传入值
- 获取今日起,前14天的数据
- 定义方法,求日期
// 获取当前时间,day为number,getDay(-1):昨天的日期;getDay(0):今天的日期;getDay(1):明天的日期;【以此类推】
    getDay (day) {
      var today = new Date()
      today.setTime(today.getTime() + 1000 * 60 * 60 * 24 * day) // 注意,这行是关键代码
      var tYear = today.getFullYear()
      var tMonth = today.getMonth()
      var tDate = today.getDate()
      tMonth = this.doHandleMonth(tMonth + 1)
      tDate = this.doHandleMonth(tDate)
      return tYear + '-' + tMonth + '-' + tDate
    },
- 求14天日期,并存储到localStorage
// 求14天日期
    for (var i = 0; i > -14; i--) {
      this.forthDay.push(this.getDay(i))
    }
    window.localStorage.setItem('yester', JSON.stringify(this.forthDay))
- 在需要的地方,取出14天日期
this.newYester = JSON.parse(window.localStorage.getItem('yester')).reverse()
- 存数组用
JSON.stringify取数组用JSON.parse日期翻转 .reverse()


