ECharts使用从0到1 -- 以vue-echarts为例
虽然老早就看过很多echarts的例子, 但自己接触的项目中一直都没有真正用到过, 这次做了一个后台管理系统,终于用到了, 下面我就纪录下, 从一开始什么都没有到最后将图标画出来的步骤, 以便日后查阅。
参考之一: github上的vue-echarts-v3根据里面的步骤一步步来, 就能够绘制出一个简单的柱形图了
参考二: echarts的官网api文档
结合上述两个url, 就能绘制出自己想要的效果了。 接下来, 是我在使用过程中的一些纪录代码。
首先,import 进echarts之后, 我们像以下方式进行使用:
    //: option后面跟着的就是接下来要说的配置内容了
    //: loading表示时候要显示loading效果
    //: onClick是点击折线上每一个点时候触发的事件
    <div class="echarts">
        "line" :loading="loading" @click="onClick">
    div>
接下来, 我们将关于图表的配置信息写在data中, 即:
data(){
    return {
        line: {
            // code here
        }
    }
}
接下来, 就一一讲解line里面的配置项目了
// text表示图表的标题内容
title: {
    text: 'echarts的基本使用',
    // subtext: '我是子标题'
},tooltip: {
// 控制鼠标滑过折线点出现的窗口内容哪个坐标值在上 默认series中标注的name值
// 加了trigger: 'axis'之后就变成折线点对应的x轴坐标值在上方
trigger: 'axis',
// 去掉鼠标滑过折线点的时候默认出现的线条
axisPointer: {
type: 'none'
}
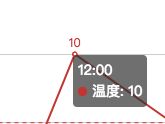
},如下图所示:
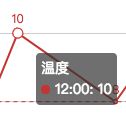
如果没有写trigger: ‘axis’的话则显示效果为:
// echarts为我们提供的一些工具方法
 toolbox: {
   show: true,
   feature: {
        dataZoom: {
             yAxisIndex: 'none'
        },
        dataView: {
             readOnly: false
        },
        magicType: {
            type: ['line', 'bar']
        },
        restore: {},
        saveAsImage: {}
   }
},
工具条如下图所示, 主要包括下载图片,转换为柱状图等…
![]()
            // x轴设置,真实项目中data数据是动态填充的, 这里作为一个demo, 直接给固定内容
            xAxis: {
                    name: '横坐标',
                    type: 'category',
                    // true的话, 数据的显示位置在中间 默认就是true
                    // boundaryGap: true,
                    // 设置横坐标数据的摆放样式
                    axisLabel: {
                        interval: 0,
                        rotate: -60,
                        showMinLabel: true
                    },
                    axisTick: {
                        length: 5
                    },
                    data: ['8:00', '10:00', '12:00', '14:00', '16:00', '18:00', '20:00']
}, yAxis: {
name: '纵坐标',
type: 'value',
// 可以通过splitNumber进行改变分割间隔,默认值是5
splitNumber: 8,
axisLabel: {
formatter: '{value} °C'
}
}, // 如果绘制的是两条折线, 那么series就有两个对象值
series: [{
name: '温度',
type: 'line',
data: [0, 3, 10, 8, 12, 13, 10],
// 控制是否显示折线上每个点对应的y坐标值
label: {
normal: {
show: true
}
},
// 标注出最大值和最小值
markPoint: {
data: [{
type: 'max',
name: '最大值'
},
{
type: 'min',
name: '最小值'
}
]
},
// 标注出y轴平均值 线
markLine: {
data: [{
type: 'average',
name: '平均值'
}]
}
}
]最后就是点击每一个折线点触发的事件, 通过这个事件我们就可以实现弹窗等效果。。。,假设我们在created里面发起请求, 拿到数据赋给dataList变量,数据格式为:
[{
                "scoreId": 209,
                "databaseType": "AMS",
                "totalScore": 3,
                "date": "20170522 10:34:44",
                "reportType": "MERGE_NEWEST"
            },
            {
                "scoreId": 209,
                "databaseType": "AMS",
                "totalScore": 8,
                "date": "20170522 10:34:44",
                "reportType": "MOTHER_NEWEST"
}] onClick(event, instance, echarts) {
// 如果我们要获取点击到的折线点的scoreId发起一个请求
// 那么this.dataList[event.dataIndex].scoreId, 拿到这个值我们就可以根据需要随意进行处理了;
console.log('arguments:', arguments);
console.log('event:', event);
console.log('instance:', instance);
console.log('echarts:', echarts);
},还有不要忘记了style
.echarts {
    width: 100%;
    height: 600px;
}
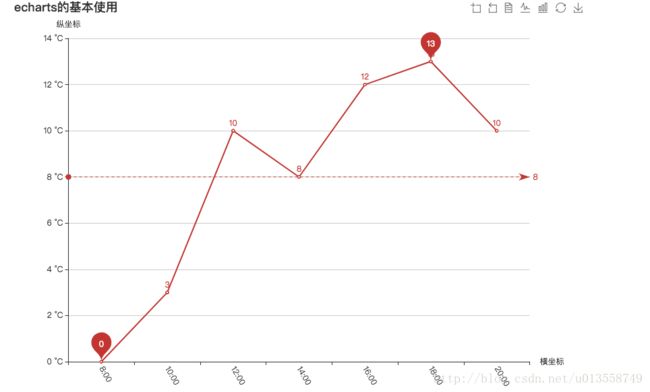
来个完整大图


