pyecharts数据可视化应用(二)
主要是以下几点:
(一)、 pyecharts绘制树图;
(二)、 散点图矩阵绘制;
(三)、 词云图、主题河流图、文本关系图的绘制;
(四)、 地理热力图、地图上标注点的绘制
1、使用以下JSON数据绘制树图、矩形树图。
树图:
from pyecharts import options as opts
from pyecharts.charts import Tree

data = [{
    "name": "flare",
    "children": [
        {
            "name": "flex",
            "children": [
                {"name": "FlareVis", "value": 4116}
            ]
        },
        {
            "name": "scale",
            "children": [
                {"name": "IScaleMap", "value": 2105},
                {"name": "LinearScale", "value": 1316},
                {"name": "LogScale", "value": 3151},
                {"name": "OrdinalScale", "value": 3770},
                {"name": "QuantileScale", "value": 2435},
                {"name": "QuantitativeScale", "value": 4839},
                {"name": "RootScale", "value": 1756},
                {"name": "Scale", "value": 4268},
                {"name": "ScaleType", "value": 1821},
                {"name": "TimeScale", "value": 5833}
           ]
        },
        {
            "name": "display",
            "children": [
                {"name": "DirtySprite", "value": 8833}
           ]
        }
    ]
}]

c = (
    Tree()
    .add("", data)
    .set_global_opts(title_opts=opts.TitleOpts(title="Tree"))
    .render("tree_base.html")
)
from pyecharts import options as opts
from pyecharts.charts import TreeMap

data = [{
    "name": "flare",
    "children": [
        {
            "name": "flex",
            "children": [
                {"name": "FlareVis", "value": 4116}
            ]
        },
        {
            "name": "scale",
            "children": [
                {"name": "IScaleMap", "value": 2105},
                {"name": "LinearScale", "value": 1316},
                {"name": "LogScale", "value": 3151},
                {"name": "OrdinalScale", "value": 3770},
                {"name": "QuantileScale", "value": 2435},
                {"name": "QuantitativeScale", "value": 4839},
                {"name": "RootScale", "value": 1756},
                {"name": "Scale", "value": 4268},
                {"name": "ScaleType", "value": 1821},
                {"name": "TimeScale", "value": 5833}
           ]
        },
        {
            "name": "display",
            "children": [
                {"name": "DirtySprite", "value": 8833}
           ]
        }
    ]
}]
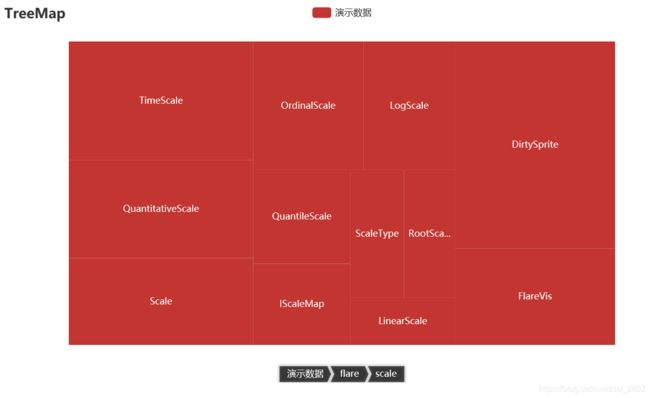
c = (
    TreeMap()
    .add("演示数据", data)
    .set_global_opts(title_opts=opts.TitleOpts(title="TreeMap"))
    .render("treemap_base.html")
)
结果如下图:
 2. 绘制鸢尾花数据的相关性矩阵(数据:iris.csv)。
import pandas as pd
import matplotlib.pyplot as plt
import seaborn as sns

data = pd.read_csv("iris.csv")
sns.set()
sns.pairplot(data,hue="Species")
plt.show()
from pyecharts import options as opts
from pyecharts.charts import Map
import random
province = ['广东', '湖北', '湖南', '四川', '重庆', '黑龙江', '浙江',
            '山西', '河北', '安徽', '河南', '山东', '西藏']
data = [(i, random.randint(50, 150)) for i in province]
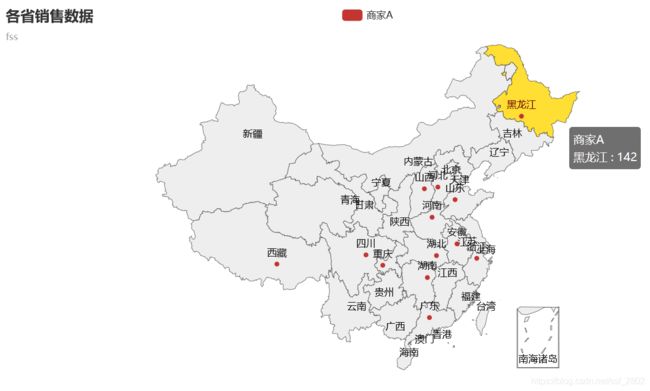
map=(
    Map()
    .add("商家A",data,"china")
    .set_global_opts(title_opts=opts.TitleOpts(title="各省销售数据",subtitle="fss"))
    .render("map_base.html")
)
结果如下图:
 4. 绘制地理热点图展示某连锁企业在湖北省各城市的门店数。
(我用了两种不同属性做)
Map属性:
from pyecharts import options as opts
from pyecharts.charts import Map
import random
province = ['武汉市', '十堰市', '鄂州市', '宜昌市', '荆州市', '孝感市', '黄石市', '咸宁市', '仙桃市']
data = [(i, random.randint(50, 150)) for i in province]
m=(
    Map()
    .add("门店数",data,"湖北")
    .set_global_opts(title_opts=opts.TitleOpts(title="某企业在湖北各市的门店数",subtitle="fss"),
                    visualmap_opts = opts.VisualMapOpts()
                     )
    .render("map_hubei.html")
)
from pyecharts import options as opts
from pyecharts.charts import Geo
from pyecharts.globals import ChartType
import random
province = ['武汉市', '十堰市', '鄂州市', '宜昌市', '荆州市', '孝感市', '黄石市', '咸宁市', '仙桃市']
data = [(i, random.randint(50, 150)) for i in province]
c = (
    Geo()
    .add_schema(maptype="湖北")
    .add(
        "geo",
        data,
        type_=ChartType.HEATMAP,
    )
    .set_series_opts(label_opts=opts.LabelOpts(is_show=False))
    .set_global_opts(
        visualmap_opts=opts.VisualMapOpts(), title_opts=opts.TitleOpts(title="Geo-湖北地图",subtitle="fss")
    )
    .render("geo_hubei.html")
)
结果如下图:
 5. 绘制词云图(数据:word_data.csv)
import pyecharts.options as opts
from pyecharts.charts import WordCloud
import pandas as pd
data=pd.read_csv('word_data.csv',encoding='utf-8')
data2 = data.groupby(by=['category']).agg({'views': sum}).reset_index().values
c=(
    WordCloud()
    .add("", data2, word_size_range=[20,100])
    .set_global_opts(
        title_opts=opts.TitleOpts(
            title="热点分析", title_textstyle_opts=opts.TextStyleOpts(font_size=23),subtitle="fss"
        ),
        tooltip_opts=opts.TooltipOpts(is_show=True),
    )
    .render("basic_wordcloud.html")
)
#数据
datax = ['分支1', '分支2', '分支3', '分支4', '分支5', '分支6']
datay = [
    ['2015/11/08', 10, '分支1'], ['2015/11/09', 15, '分支1'], ['2015/11/10', 35, '分支1'],
    ['2015/11/14', 7, '分支1'], ['2015/11/15', 2, '分支1'], ['2015/11/16', 17, '分支1'],
    ['2015/11/17', 33, '分支1'], ['2015/11/18', 40, '分支1'], ['2015/11/19', 32, '分支1'],
    ['2015/11/20', 26, '分支1'], ['2015/11/21', 35, '分支1'], ['2015/11/22', 40, '分支1'],
    ['2015/11/23', 32, '分支1'], ['2015/11/24', 26, '分支1'], ['2015/11/25', 22, '分支1'],
    ['2015/11/08', 35, '分支2'], ['2015/11/09', 36, '分支2'], ['2015/11/10', 37, '分支2'],
    ['2015/11/11', 22, '分支2'], ['2015/11/12', 24, '分支2'], ['2015/11/13', 26, '分支2'],
    ['2015/11/14', 34, '分支2'], ['2015/11/15', 21, '分支2'], ['2015/11/16', 18, '分支2'],
    ['2015/11/17', 45, '分支2'], ['2015/11/18', 32, '分支2'], ['2015/11/19', 35, '分支2'],
    ['2015/11/20', 30, '分支2'], ['2015/11/21', 28, '分支2'], ['2015/11/22', 27, '分支2'],
    ['2015/11/23', 26, '分支2'], ['2015/11/24', 15, '分支2'], ['2015/11/25', 30, '分支2'],
    ['2015/11/26', 35, '分支2'], ['2015/11/27', 42, '分支2'], ['2015/11/28', 42, '分支2'],
    ['2015/11/08', 21, '分支3'], ['2015/11/09', 25, '分支3'], ['2015/11/10', 27, '分支3'],
    ['2015/11/11', 23, '分支3'], ['2015/11/12', 24, '分支3'], ['2015/11/13', 21, '分支3'],
    ['2015/11/14', 35, '分支3'], ['2015/11/15', 39, '分支3'], ['2015/11/16', 40, '分支3'],
    ['2015/11/17', 36, '分支3'], ['2015/11/18', 33, '分支3'], ['2015/11/19', 43, '分支3'],
    ['2015/11/20', 40, '分支3'], ['2015/11/21', 34, '分支3'], ['2015/11/22', 28, '分支3'],
    ['2015/11/14', 7, '分支4'], ['2015/11/15', 2, '分支4'], ['2015/11/16', 17, '分支4'],
    ['2015/11/17', 33, '分支4'], ['2015/11/18', 40, '分支4'], ['2015/11/19', 32, '分支4'],
    ['2015/11/20', 26, '分支4'], ['2015/11/21', 35, '分支4'], ['2015/11/22', 40, '分支4'],
    ['2015/11/23', 32, '分支4'], ['2015/11/24', 26, '分支4'], ['2015/11/25', 22, '分支4'],
    ['2015/11/26', 16, '分支4'], ['2015/11/27', 22, '分支4'], ['2015/11/28', 10, '分支4'],
    ['2015/11/08', 10, '分支5'], ['2015/11/09', 15, '分支5'], ['2015/11/10', 35, '分支5'],
    ['2015/11/11', 38, '分支5'], ['2015/11/12', 22, '分支5'], ['2015/11/13', 16, '分支5'],
    ['2015/11/14', 7, '分支5'], ['2015/11/15', 2, '分支5'], ['2015/11/16', 17, '分支5'],
    ['2015/11/17', 33, '分支5'], ['2015/11/18', 40, '分支5'], ['2015/11/19', 32, '分支5'],
    ['2015/11/20', 26, '分支5'], ['2015/11/21', 35, '分支5'], ['2015/11/22', 4, '分支5'],
    ['2015/11/23', 32, '分支5'], ['2015/11/24', 26, '分支5'], ['2015/11/25', 22, '分支5'],
    ['2015/11/26', 16, '分支5'], ['2015/11/27', 22, '分支5'], ['2015/11/28', 10, '分支5'],
    ['2015/11/08', 10, '分支6'], ['2015/11/09', 15, '分支6'], ['2015/11/10', 35, '分支6'],
    ['2015/11/11', 38, '分支6'], ['2015/11/12', 22, '分支6'], ['2015/11/13', 16, '分支6'],
    ['2015/11/14', 7, '分支6'], ['2015/11/15', 2, '分支6'], ['2015/11/16', 17, '分支6'],
    ['2015/11/17', 33, '分支6'], ['2015/11/18', 4, '分支6'], ['2015/11/19', 32, '分支6'],
    ['2015/11/20', 26, '分支6'], ['2015/11/21', 35, '分支6'], ['2015/11/22', 40, '分支6'],
    ['2015/11/23', 32, '分支6'], ['2015/11/24', 26, '分支6'], ['2015/11/25', 22, '分支6']
]
#主要代码
import pyecharts.options as opts
from pyecharts.charts import ThemeRiver

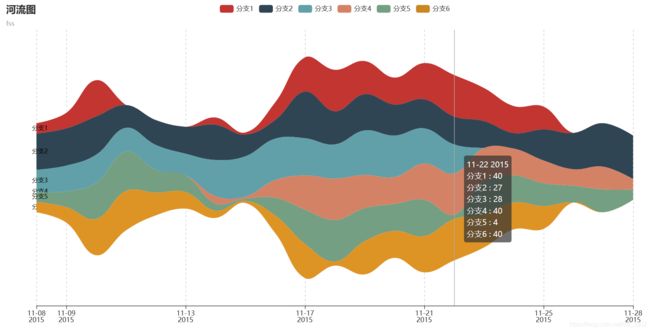
(
    ThemeRiver(init_opts=opts.InitOpts(width="1200px", height="600px"))
    .add(
        series_name=datax,
        data=datay,
        singleaxis_opts=opts.SingleAxisOpts(
            pos_top="50", pos_bottom="50", type_="time"
        ),
    )
    .set_global_opts(
        title_opts=opts.TitleOpts(title="河流图",subtitle="fss"),
        tooltip_opts=opts.TooltipOpts(trigger="axis", axis_pointer_type="line")
    )
    .render("theme_river.html")
)


