python可视化pyecharts
pyecharts简介
说到数据可视化,第一想到的肯定是百度的ECharts。它的英文单词是Enterprise Charts,商业级数据图表,是百度的开源数据可视化工具。但是学习起来不是那么容易,但是我们利用 python 的pyecharts 库,只需几行代码就可以画出很炫的图片。
画图3步骤
- 第一步:准备数据
- 第二步:初始化具体类型图表
语法:图片名称 = 图表类型(“图表名称”)
图表类型:
Bar(柱状图/条形图)
Bar3D(3D 柱状图)
Boxplot(箱形图)
EffectScatter(带有涟漪特效动画的散点图)
Funnel(漏斗图)
Gauge(仪表盘)
Geo(地理坐标系)
Graph(关系图)
HeatMap(热力图)
Kline(K线图)
Line(折线/面积图)
Line3D(3D 折线图)
Liquid(水球图)
Map(地图)
Parallel(平行坐标系)
Pie(饼图)
Polar(极坐标系)
Radar(雷达图)
Sankey(桑基图)
Scatter(散点图)
Scatter3D(3D 散点图)
ThemeRiver(主题河流图)
WordCloud(词云图) - 第三步:添加图标属性的数据,图表类型.add()
- 第四步:把图片保存到本地,格式为html
语法为:图表类型.render()
pyecharts具体使用
柱状图
from pyecharts import Bar
# 准备数据
label = ["粮面类", "饮料类", "衣服类", "文具类", "酒类", "水果类"]
data = [40, 90, 30, 10, 60, 77]

# 第一步,主标题,副标题
bar = Bar("超市销量", "模拟")
# 设置主题颜色,pyechars自带主题为dark
# bar.use_theme('dark')

# 安装主题插件
# pip install echarts-themes-pypkg
# vintage, macarons, infographic, shine 和 roma 主题
bar.use_theme('macarons')

# 第二步
bar.add("日用品", label, data, is_more_utils=True)

# 第三步,生成html文件,打开后显示柱状图
bar.render()
词云图
from pyecharts import WordCloud
name = ['Sam S Club', 'Macys', 'Amy Schumer', 'Jurassic World', 'Charter Communications', 'Chick Fil A',
        'Planet Fitness', 'Pitch Perfect', 'Express', 'Home', 'Johnny Depp', 'Lena Dunham', 'Lewis Hamilton', 'KXAN',
        'Mary Ellen Mark', 'Farrah Abraham', 'Rita Ora', 'Serena Williams', 'NCAA baseball tournament', 'Point Break']
value = [10000, 6181, 4386, 4055, 2467, 2244, 1898, 1484, 1112, 965, 847, 582, 555, 550, 462, 366, 360, 282, 273, 265]
wordCloud = WordCloud(width=1300, height=620)
wordCloud.add("", name, value, word_size_range=[20, 100])
wordCloud.show_config()
wordCloud.render()
pv图
中国地图在 echarts-countries-pypkg 里。需要这些地图的朋友,可以装 pip 命令行:
$ pip install echarts-countries-pypkg
$ pip install echarts-china-provinces-pypkg
$ pip install echarts-china-cities-pypkg
$ pip install echarts-china-counties-pypkg
$ pip install echarts-china-misc-pypkg
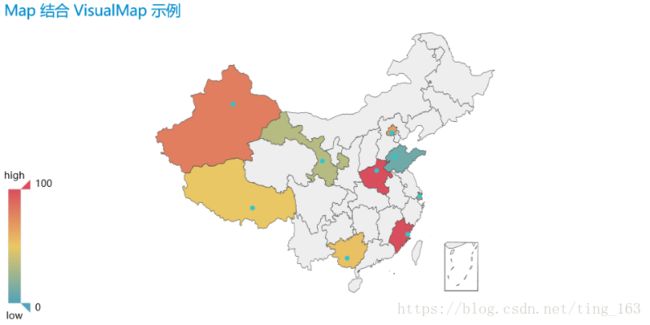
from pyecharts import Map
value = [155, 10, 66, 78, 33, 80, 190, 53, 49.6]
attr = ["福建", "山东", "北京", "上海", "甘肃", "新疆", "河南", "广西", "西藏"]
map = Map("Map 结合 VisualMap 示例", width=800, height=400)
map.add("", attr, value, maptype='china', is_visualmap=True, visual_text_color='#000')
map.show_config()
map.render()参考文档
- pyecharts官网
- 参考博文


