数据透视表切片器显示空白
Instead of adding and removing pivot table values one at a time, click a Slicer, to quickly add and remove them, in groups. Most pivot tables won't need this, but for source data with lots of numeric fields, this slicer technique can make things easier.
单击“切片器”以成组快速添加和删除它们,而不是一次添加和删除数据透视表值。 大多数数据透视表都不需要这样做,但是对于具有大量数字字段的源数据,这种切片器技术可以使事情变得更容易。
切片器演示 (Slicer Demo)
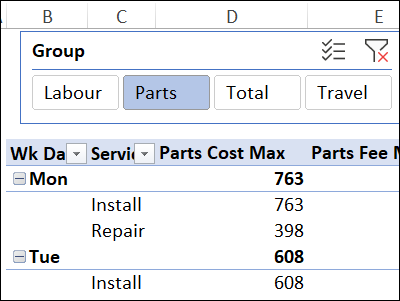
In this example, there’s a table with work order data, and a pivot table based on that data. There are two Slicers above the pivot table:
在此示例中,有一个包含工单数据的表,以及一个基于该数据的数据透视表。 数据透视表上方有两个切片器:
- Click the Group Slicer, to quickly show values from the selected category. 单击“组切片器”,以快速显示所选类别中的值。
- Click the Function slicer to set the function and heading for each value 单击功能切片器以设置功能和每个值的标题
源数据编号字段 (Source Data Number Fields)
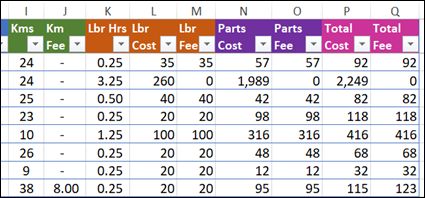
This pivot table is based on a table with work order records, and about half of the columns have numbers. Those number columns fall into four categories (groups).
该数据透视表基于具有工单记录的表,大约一半的列具有数字。 这些数字列分为四个类别(组)。
Travel — Kms, Km Fee
旅行 —公里,公里费用
Labour — Lbr Hrs, Lbr Cost, Lbr Fee
人工 — Lbr小时,Lbr成本,Lbr费用
Parts — Parts Cost, Parts Fee
零件 —零件成本,零件费用
Total — Total Cost, Total Fee
总计 —总计费用,总计费用
In the sample file, I colour coded the column headings, just to make the groups easier to identify.
在示例文件中,我对列标题进行了颜色编码,以使组更易于识别。
- headings don't need to be coloured 标题不需要上色
- columns could be in any order in the source data 列可以在源数据中以任何顺序排列
价值组列表 (Value Groups List)
To put the fields into groups, all the numeric fields are listed in an Excel table. In the table's second column, each field is assigned to one of the 4 value groups.
为了将字段分组,所有数字字段都在Excel表中列出。 在表的第二列中,每个字段都分配给4个值组之一。
If you're setting this up in a different workbook, you can create as many groups as your data needs, and fields can be assigned to multiple groups, if needed.
如果要在其他工作簿中进行设置,则可以根据数据需要创建任意多个组,并且可以根据需要将字段分配给多个组。
For example, all the Labour and Parts fields could be listed again, in a group named Parts & Labour.
例如,可以在名为“零件和劳动力”的组中再次列出所有“人工和零件”字段。
数据透视表和切片机 (Pivot Table and Slicer)
A pivot table was built from the Value/Group table, and it has the Group field in its Filter area.
数据透视表是根据“值/组”表构建的,并且其“过滤器”区域中具有“组”字段。
There’s a Slicer connected to that pivot table, and that's what you click to select one of the Value groups, to show in the main pivot table.
在该数据透视表上连接了一个Slicer,这是您单击以选择“值”组之一以显示在主数据透视表中的内容。
运行宏 (Run a Macro)
When you click the Slicer, it updates the connected pivot table, and a macro runs automatically, to:
单击“切片器”时,它会更新连接的数据透视表,并且宏会自动运行到:
- remove all the current value fields 删除所有当前值字段
- add all fields from the selected group 添加所选组中的所有字段
A dynamic array formula creates a list of all the selected group's fields:
动态数组公式将创建所有选定组字段的列表:
=SORT(FILTER(tblFields[Field], tblFields[Group]=K3))
= SORT(FILTER(tblFields [Field],tblFields [Group] = K3))
The formula is in cell M4, and it spills into the cells below.
该公式在单元格M4中,它溢出到下面的单元格中。
功能切片器 (Function Slicer)
There's a function slicer in the workbook too, where you can select from 5 common summary functions.
工作簿中也有一个功能切片器,您可以在其中选择5种常见的汇总功能。
It's set up in a similar way, with a list of functions, a pivot table based on the list, and a Slicer connected to the pivot table.
它以类似的方式设置,具有功能列表,基于该列表的数据透视表以及连接到数据透视表的切片器。
获取详细信息和样本文件 (Get Details & Sample File)
To get the sample file, and to see the details on how this technique works, go to the Value Group Slicers page on my Contextures site.
若要获取示例文件,并查看有关此技术如何工作的详细信息,请转到Contextures网站上的“ 值组切片器”页面。
The file is zipped, and is in xlsm format. The file contains macros which run when the slicers are clicked. Be sure to enable macros when you open the workbook, if you want to test the Slicers.
该文件已压缩,格式为xlsm。 该文件包含单击切片器时运行的宏。 如果要测试切片器,请确保在打开工作簿时启用宏。
翻译自: https://contexturesblog.com/archives/2020/08/20/show-pivot-table-values-with-slicer/
数据透视表切片器显示空白


