如何在SAP WebClient UI里使用jChartFX
In my blog CRM One Order statistic tool I develop a small tool to print out the statistics of number of assigned line item for all business documents in the system.
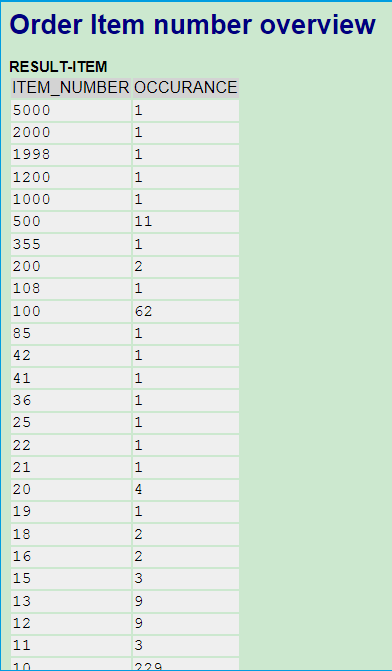
The tool has the following three sections of output in SAPGUI.
This section means there are 1 order which has 5000 line items, 1 order has 2000 items, 1 order has 1998 items …
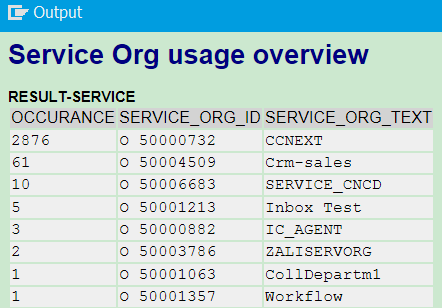
Accordingly, this section below means Sales Organization 50000732 has been used in 38746 Business document, Organization 50001194 used in 1346 Business document.

And this is for Service Organization unit.
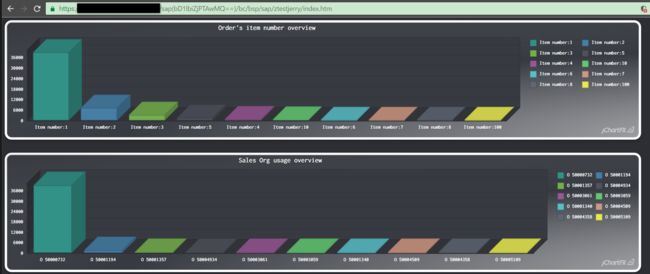
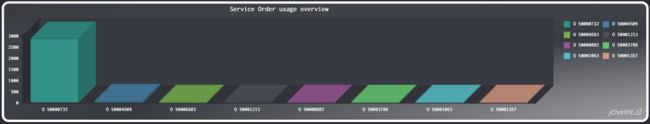
In this blog, I will introduce how to display the output in browser instead, using a chart library jChartFX.
You can refer to final achievement below:
Here below is detail step to build this tool.
Step1. Create a new BSP application in SE80, and create a new page index.htm.
Paste the following source code to index.htm:
<%@page language="abap" %>

<html>
<head>
    <script src="jchartlib/js/jquery1.7.1.js" >
    script>
    <script src="jchartlib/chartUtil.js" >
    script>
    <script src="jchartlib/js/jchartfx.system.js">
    script>
    <script src="jchartlib/js/jchartfx.coreVector.js">
    script>
    <script src="jchartlib/js/jchartfx.coreVector3D.js">
    script>
    <script src="jchartlib/js/jchartfx.advanced.js">
    script>
    <script src="jchartlib/js/jchartfx.gauge.js">
    script>
     <script>
        function initialize() {
            initChart("divChart1", "Order's item number overview",
            <%= zcl_crm_order_statistic=>get_item_json( ) %>);
            initChart("divChart2", "Sales Org usage overview",
            <%= zcl_crm_order_statistic=>get_sales_json( ) %>);
            initChart("divChart3", "Service Order usage overview",
            <%= zcl_crm_order_statistic=>get_service_json( ) %>);
        }

    script>
         <link rel="stylesheet" type="text/css" href="jchartlib/styles/Attributes/jchartfx.attributes.aurora.css" />
    <link rel="stylesheet" type="text/css" href="jchartlib/styles/Palettes/jchartfx.palette.aurora.css" />

     <style type="text/css">
        .jchartfx .AxisY_Text {
            fill: #FEFEFE;
    }

    .jchartfx .AxisX_Text {
        fill: #FEFEFE;
    }

    .jchartfx .Title {
        fill: #FEFEFE;
    }

    .jchartfx .LegendItem {
        fill: #FEFEFE;
    }
    style>
}
head>
<body class="jchartfx_body">
  <div class="jchartfx_container">
    <div id="divChart1" style="width:90%;height:270px;display:inline-block;position:absolute;left:0px;top:0px">div>
    <div id="divChart2" style="width:90%;height:270px;display:inline-block;position:absolute;left:0px;top:280px">div>
    <div id="divChart3" style="width:90%;height:270px;display:inline-block;position:absolute;left:0px;top:570px">div>
    <script language="javascript">
        $(document).ready(function ($) {
            initialize();
        });
    script>
    div>
div>
body>
html>
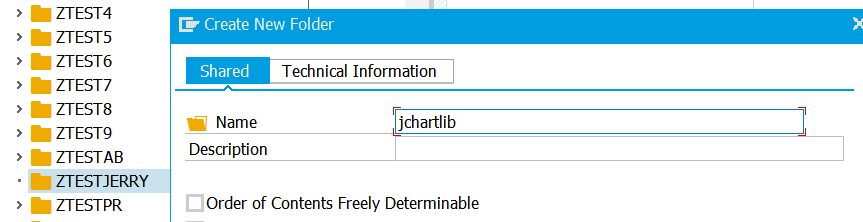
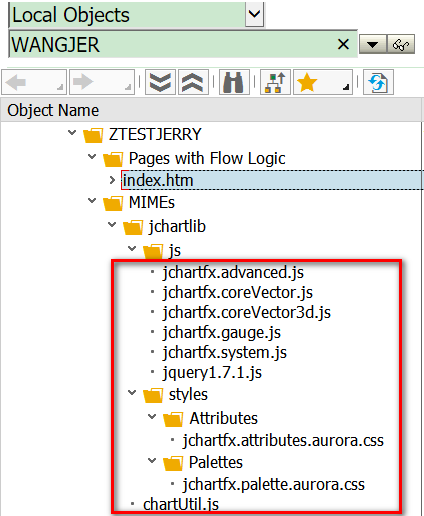
Step2. Switch to MIME Repository in SE80, create a new folder for this BSP application:
And import the following js and css file into the BSP application.

Step3. Add the following one line in OnCreate event handler of this BSP application.
The tool basically scan the CRM business document header table CRMD_ORDERADM_H and item table CRMD_ORDERADM_I and HR table hrp1000 to calculate the result.
要获取更多Jerry的原创文章,请关注公众号"汪子熙":
