subplot函数介绍
#!/usr/bin/python
# -*- coding: utf-8 -*-
"""
@author:
@contact:
@time:
"""

# subplot函数介绍
import matplotlib.pyplot as plt
plt.figure(figsize=(12, 12),facecolor='gray',edgecolor='g')
plt.subplot(221)
plt.show()

"""
figure:
figsize:以英寸为单位的宽高(1英寸等于2.54厘米)
facecolor:背景色
edgecolor:边框色

subplot:
subplot(numRows, numCols, plotNum)
图表的整个绘图区域被分成 numRows 行和 numCols 列
plotNum 参数指定创建的 Axes 对象所在的区域
numRows,numCols和plotNum这三个数都小于10的话,可以把它们缩写为一个整数,
例如 subplot(323) 和 subplot(3,2,3) 是相同的.

颜色:
b:blue
g:green
r:red
c:cyan,青绿色
y:yellow
k:black
w:white
purple :紫色
"""
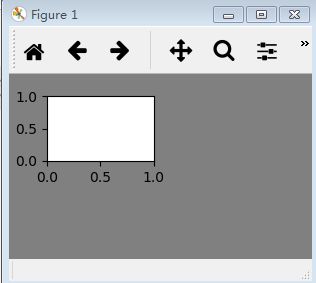
运行结果:
