Matlab 读取—处理—保存遥感影像(带有地理信息的图像)
Start_Latitude = 0.6;

End_Latitude = 0.8;

Start_Lontitude = 0.1;

End_Lontitude = 0.3;Matlab读取遥感影像的函数是:geotiffread(针对的是tif数据文件)
一、简介
(1)数据读取
[A,R] = geotiffread(filename) ;Reads a georeferenced grayscale, RGB, or multispectral image or data grid from the GeoTIFF file specified by filename into A and creates a spatial referencing object, R.(官方解释)。
描述一下就是 A 代表的数据文件(高程之类的数据),R 为空间坐标信息(包括数据的大小,经纬度范围与起始经纬度,数据单位、方向等)。
读取部分到此为止!
(2)数据处理
我这里主要介绍的数据的裁剪(比如要从一块数中选择其中的某一部分画图等)。
我们应该很清楚在做数据裁剪时会用到Matlab的冒号(:)函数,这个也是很简单。但是我们在对含有地理坐标的数据进行裁剪时,经纬度信息也要对应数据裁剪的办法进行裁剪。
Start_Latitude = 0.6;

End_Latitude = 0.8;

Start_Lontitude = 0.1;

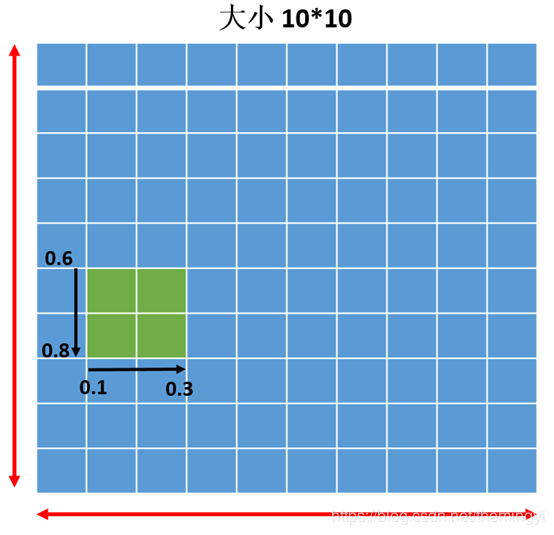
End_Lontitude = 0.3;以上四个部分是裁剪的核心部分,只要修改对应的这四个值就可以选择裁剪对应的数据区域。比如在一个10*10的矩阵中,上面的四个数字(0.6,0.8 ;0.1,0.3)对应的区域如图1中的绿色区域。
图1 示例图
(3)数据保存
geotiffwrite(filename,A,R) writes a georeferenced image or data grid, A, spatially referenced by R, into an output file, filename.
操作与读取类似,不再赘述!
二、例子
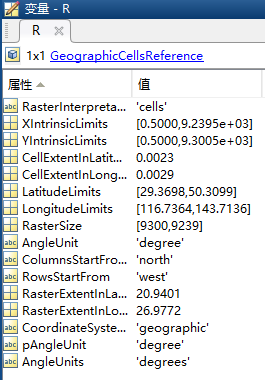
图2 原始数据
图3 原始数据地理坐标信息
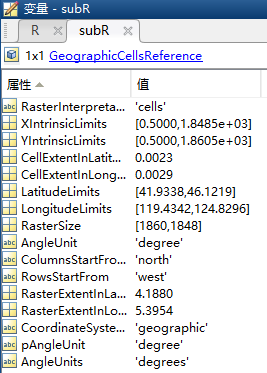
图4 截取之后的地理坐标信息
(1)Code:
function Geographic_RPW()
tic %Record the running time
%% Read file
[Data,R] = geotiffread('D:\20181102\CSDN-博文\Matlab处理地理数据\ndvi2.tif');
%% Select interception position
Start_Latitude = 0.6;
End_Latitude = 0.8;
Start_Lontitude = 0.1;
End_Lontitude = 0.3;
%需要补充一下此四个数的意义

%% cuttiing into certain shape
Posion = [Start_Latitude,End_Latitude;Start_Lontitude,End_Lontitude];
[row, col] = size(Data);
first_row = floor(Posion(1,1)*row)+1;%起始维度(加1为了避免first_row=0,使用ceil函数可以不用加1)
last_row = floor(Posion(1,2)*row);%结束维度
first_col = floor(Posion(2,1)*col)+1;%起始经度(加1为了避免first_row=0,使用ceil函数可以不用加1)
last_col = floor(Posion(2,2)*col);%结束经度
subImage = Data(first_row:last_row, first_col:last_col);%数据截取

%% Set GeographicCells Reference parameters
%文件的地理坐标信息还有样本大小信息同样也是需要截取的和更新的,截取的基本理论类似与数据的截取办法。
% mainly set the range of latitude and lontitude
subR = R;%原始数据的地理坐标信息和数据大小等信息。
subR.RasterSize = size(subImage);%跟新截取后的数据大小信息
del_La = subR.LatitudeLimits(2) - subR.LatitudeLimits(1);% the scale of latitude(纬度的最大值减去最小值)
del_Lon = subR.LongitudeLimits(2) - subR.LongitudeLimits(1);% the scale of lontitude(经度的最大值减去最小值)
subR.LatitudeLimits = [subR.LatitudeLimits(1)+Posion(1,1)*del_La,...
    subR.LatitudeLimits(2) - del_La*(1 - Posion(1,2))];%截取位置的维度范围
subR.LongitudeLimits = [subR.LongitudeLimits(1)+Posion(2,1)*del_Lon,...
    subR.LongitudeLimits(2) - del_Lon*(1 - Posion(2,2))];%截取位置的经度范围

%% Data processing
%一些最基本的数据处理,在此要根据数据的性质(大小与分布规律看一下)
%在matlab调试中看一下截取后的数据的值,下面这个处理过程只是针对我
%所要解决的一个问题。
[row,col] = size(subImage);
for i = 1:row
   for j = 1:col
      if subImage(i,j)<0
          subImage(i,j) = 0;
      elseif subImage(i,j)>0
          subImage(i,j) = 1;
      end
   end
end

for i = floor(0.45*row):floor(0.8*row)
   for j = floor(0.14*col):floor(0.5*col)
      if subImage(i,j)<=0
          subImage(i,j) = 0;
      elseif subImage(i,j)>0
          subImage(i,j) = 2;
      end
   end
end
%% Preview the interception posion
figure(1);
imshow(subImage);%黑白图
figure(2);
imagesc(subImage);%彩色图

%% Writiing the data to a new GEOTIFF file
filename = 'C:\Users\Administrator\Desktop\ndvi-new.tif';
geotiffwrite(filename,subImage,subR);%保存文件
toc%Recording the time when the program end running
%% Writed By themingyi
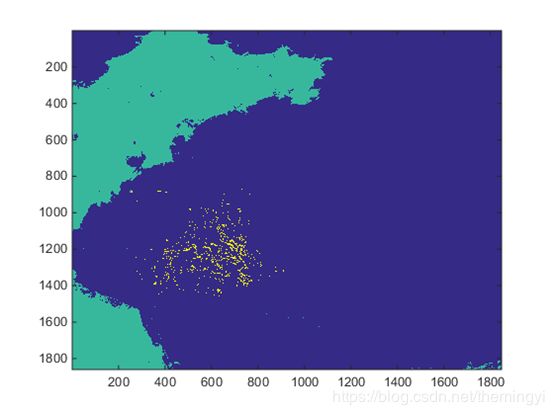
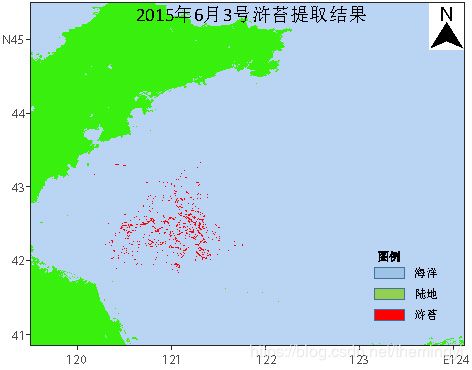
%2018/12/05(2)处理结果
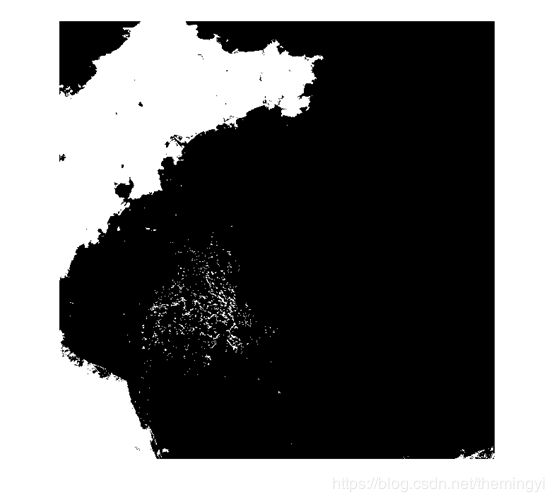
图5 imshow展示结果
图6 imagesc 展示结果
图7 AI修改后的最终结果
PS:本程序以及所有使用的数据已经放到百度云供下载:
链接:https://pan.baidu.com/s/1o2vC_1QKyWmwvW8-g-E09Q
提取码:s97g
欢迎讨论指正,本人e-mail:[email protected]
参考:
1、https://www.mathworks.com/help/map/ref/geotiffread.html
2、https://blog.csdn.net/liyanzhong/article/details/52850581
Matlab读取带有地理信息的图像
3、http://www.ilovematlab.cn/forum.php?mod=viewthread&tid=213403
MATLAB 遥感影像的读写操作,带地理坐标信息
4、https://blog.csdn.net/qq_26906835/article/details/80841823
Matlab(一):二维矩阵转换为geoTiff
5、http://www.mathworks.com/help/map/ref/geotiffwrite.html
