切片选择
#显示第一行数据
print(df.head(1))
#显示倒数三行数据
print(df.tail(3))
loc
df.loc[row_index,col_index] 注意loc是根据行和列的索引进行选择的,行索引就是index,列索引就是列名。
loc举例:
df.loc[0,'age']=18 就能定位行索引为0,列名为‘age’的元素,然后可以直接赋值
df.loc[df.id=109,'age'] 这个就是找到id为109的索引号,然后列名还是age的元素,总之row_index可以直接填写索引号,也可以根据条件进行筛选查找
df.loc[(df.id>1)&(df.id<100),'label']=1 这个就是根据条件批量查找,然后批量赋值
iloc第一个参数表示前多少行,第二个参数表示多少列,与行索引列索引没有任何关系,完全是前多少行
print(df[0:3]) 选取前三行
print(df.iloc[1:3,1:3]) 类似于octave选择行列
print(df.iloc[1:3,-1:]) 选取最后一列
df.iloc[:,1:3] 同octave
df.iloc[1:3,:] 同octave
行筛选
df1:
日本
荷兰
df2:
eng_name,chn_name
a, 中国
b,美国
c,日本
d,瑞典
f,荷兰
根据df1筛选df2:isin(), 括号里面对应的是list
df2[df2.chn_name.isin(df1[0].tolist())]
如果是反向选择,则[]里面最前面加一个-号即可
df2[-df2.chn_name.isin(df1[0].tolist())]
#截断极值,因为极值有时候可以认为是异常数值,会干扰模型的参数
ulimit = np.percentile(train.price_doc.values, 99)
llimit = np.percentile(train.price_doc.values, 1)
train['price_doc'].loc[train['price_doc']>ulimit] = ulimit
train['price_doc'].loc[train['price_doc']
all_data[all_data['state']==33] #筛选state=33的行
df[(df.age>=20)&(df.age<28)] #注意一定要带()
生成dataframe并写入csv
output = pd.DataFrame({'id': id_test, 'price_doc': y_predict})
output.to_csv('output.csv', index=False)
#一列写入的时候,要用双[],否则会当做series没有列名。
df_header[['eng_name']].to_csv('C:\\data\\hyg\\predict_score\\eng_feature.csv',index=False)
根据不同分隔符、字符编码等读取csv,并更改列名
data_header = pd.read_csv('a.csv',encoding='gb2312',header=None,sep='\t')
df = pd.read_csv('b.csv',encoding='utf-8',header=None,sep='\t')
df.columns=list(data_header[0])
排序(降序)
df_6=df_6.sort_values('xgb_score',ascending=False)
ipython中显示dataframe中全部的列与行设置
pd.set_option('max_columns', 1000)
pd.set_option('max_rows', 1000)
去重
df.drop_duplicates(["Seqno"],keep="first").head()
df.drop_duplicates(subset=None, keep='first', inplace=False)
1 data.drop_duplicates()#data中一行元素全部相同时才去除
2 data.drop_duplicates(['a','b'])#data根据’a','b'组合列删除重复项,默认保留第一个出现的值组合。传入参数keep='last'则保留最后一个
类型转换
df.age=df['age'].astype(np.int) #注意一定要赋值过去,否则不起效
添加一行
tmp.loc[11]=('其它',300)
merge
1)len(set(df_a.eng_name)&set(df_b.eng_name)) #merge前根据某一列做key计算一下有多少个交集
2)res = pd.merge(df_a, df_b,on=['eng_name'],how='left') #on表示merge的key,how表示连接方式,默认是inner,left表示以左侧df为准,右侧没有的值为na。
3)左右键值不一样:pd.merge(df_a, df_b,left_on='k1',right_on='k2',how='left')
更改某一列的名
df3.rename(columns={'user_id':'用户ID'}, inplace = True)
df.rename(columns=lambda x:x.replace('yhhx_result.',''), inplace=True) #统一去掉列名的某个前缀
groupby 分组后进行筛选,并形成新的df
df_group_small = pd.DataFrame(columns=df.columns)
df_group_large = pd.DataFrame(columns=df.columns)
for k in set(group.keys):
if len(group.get_group(k))<3:
df_group_small=pd.concat([df_group_small,group.get_group(k)])
else:
df_group_large=pd.concat([df_group_large,group.get_group(k)])
对于时间的字段拆分处理
train = pd.read_csv('train.csv', header=0,parse_dates=['pickup_datetime'])#读取文件的时候parse_dates必须要加上

train['pickup_month'] = train['pickup_datetime'].dt.month

train['pickup_day'] = train['pickup_datetime'].dt.day

train['pickup_hour'] = train['pickup_datetime'].dt.hour

train['pickup_minute'] = train['pickup_datetime'].dt.minute

#看看是一星期中的星期几
train['dayofweek'] = train['pickup_datetime'].dt.dayofweek+1
#一年中的第几个星期
train['pickup_weekofyear'] = train['pickup_datetime'].dt.weekofyear

train['pickup_dt'] = (train['pickup_datetime'] - train['pickup_datetime'].min()).dt.total_seconds()
#一星期中的第多少个小时
train['pickup_week_hour'] = train['dayofweek'] * 24 + train['pickup_hour']
更改DataFrame中列的顺序
mid = df['Mid']
df.drop(labels=['Mid'], axis=1,inplace = True)
#重新插入到最前面,以达到更改列顺序的目的
df.insert(0, 'Mid', mid)

DataFrame一行行遍历
for row in t.itertuples(index=True, name='Pandas'):
id=getattr(row, 'USRID')
diff=getattr(row, 'diff')
或者
for _, row in df_header.iterrows():
eng_name,chn_name=row#比如有两列就可以这样直接对应赋值了,上面的_作为占位符,可以去掉index号
二维list转换成DataFrame
df=pd.DataFrame(recall_list,columns=['TOP30%','TOP35%','TOP40%','TOP45%','TOP50%'])
APPLY
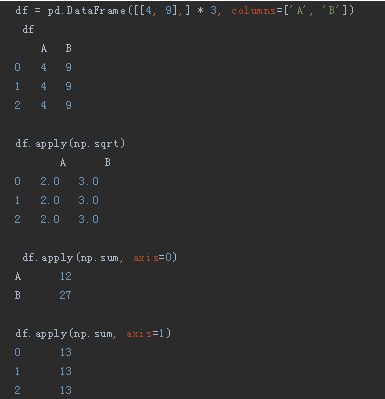
Apply将一个函数应用于指定轴上的每一个元素。 使用Apply,可以将DataFrame列(是一个Series)的值进行格式设置和操作,不用循环,非常有用!
dataframe中将数值型与字符串混杂类型强制转换成数值类型
df['username']=pd.to_numeric(df['username'],errors='coerce') #将不能转换数据类型的值强制转换成NaN
利用箱式图找出异常值分界线
data=pd.DataFrame({'a':[1,2,3,4,3,4,45,67]})
p=data[['a']].boxplot(return_type='dict')
y=p['fliers'][0].get_ydata()
y.sort()
y[0]
输出:
y=[45,67]
dataframe中判断NAN的方法
for v in df['a']:
if pd.isnull(v)
时间差计算
1)出生日期转换为年龄方法
df['出生日期']=pd.to_datetime(df['出生日期'],format='%Y%m%d',errors='coerce) #当前是什么格式format就写什么格式
df['age']=now_year-df['出生日期'].dt.year
def get_missRow_byThreshold(df,threshold):
    indexs=[]
    for index,row in df.iterrows():
        rowMissRate=sum(pd.isnull(x) for x in row.values)/len(row.values) #一行一行拆分看缺失值情况
        if rowMissRate>=threshold:
            indexs.append(index)
    return indexs

#返回索引号后,进行删除,删除缺失率高于0.8的行
indexs=get_missRow_byThreshold(df,0.8)
df.drop(indexs,inplace=True)
抽取出身份证信息中的省份
def fun(x):
    if not x is np.nan:
        x = x.strip().split('省')[0].split('自治')[0].split('维吾尔')[0].split('壮族')[0].split('回族')[0].split('市')[0]
    return x
df['id_prov'] = df['身份证归属地'].map(fun)
验证手机号所在省份与身份证所在省份是否一致
def is_identity(x,y):
    if pd.isnull(x) or pd.isnull(y):
        return np.nan
    else:
        if x.strip()==y.strip():
            return 1
        else:
            return 0
df['province_identity']=list(map(lambda x,y:is_identity(x,y),df['id_prov'],df['手机号归属省份']))
df['city_identity']=list(map(lambda x,y:is_identity(x,y),df['id_city'],df['手机号归属城市']))

