基于keras(或者tensorflow.keras)构建的模型的summary展示和plot_model结构图展示
一般在构建模型的时候,如果能在训练之前就知道模型的参数量和结构图,就能避免一些低级错误。常用的函数有summary和plot_model,下面就一个简单的个例进行展示
另外,需要说明,在tensorflow 2.0版本中,tf.keras的用法和keras的用法基本一致,两者的API说明文档完全可以相互参考。这里使用tf.keras
- summary的使用和保存
import numpy as np
import tensorflow as tf
from tensorflow.keras.layers import LSTM,Dense
from tensorflow.keras import Input,Model

num_encoder_tokens=10
latent_dim=20
num_decoder_tokens=15

def lstm_model():
    # 定义编码器的输入
    # encoder_inputs (None, num_encoder_tokens), None表示时间步
    encoder_inputs = Input(shape=(None, num_encoder_tokens),name='encoder_inputs')

    # 编码器,return_sequences表示返回每个时间步的输出,return_state表示返回最后一个时间步的h,c
    encoder = LSTM(latent_dim, return_sequences=True,
                   return_state=True,name='encoder_lstm_1')

    # 调用编码器,得到编码器的输出(解码器的输入其实不需要),以及状态信息 state_h 和 state_c
    encoder_outpus, state_h, state_c = encoder(encoder_inputs)

    # 丢弃encoder_outputs, 我们只需要编码器的状态
    encoder_state = [state_h, state_c]

    # 定义解码器的输入
    # 同样的,None表示可以处理任意长度的序列
    decoder_inputs = Input(shape=(None, num_decoder_tokens),name='decoder_inputs')

    # 接下来建立解码器,解码器将返回整个输出序列
    # 并且返回其中间状态,中间状态在训练阶段不会用到,但是在推理阶段将是有用的
    decoder_lstm = LSTM(latent_dim, return_sequences=True,
                        return_state=True,name='decoder_lstm1')

    # 将编码器输出的状态作为初始解码器的初始状态
    decoder_outputs, _, _ = decoder_lstm(decoder_inputs, initial_state=encoder_state)

    # 添加全连接层
    decoder_dense = Dense(num_decoder_tokens, activation='softmax',name='decoder_Dense')
    decoder_outputs = decoder_dense(decoder_outputs)

    model=Model([encoder_inputs,decoder_inputs],decoder_outputs)

    return model

lstm_test_model=lstm_model()

#line_length表示summary的输出大小(长度),
lstm_test_model.summary(line_length=150,positions=[0.30,0.60,0.7,1.])
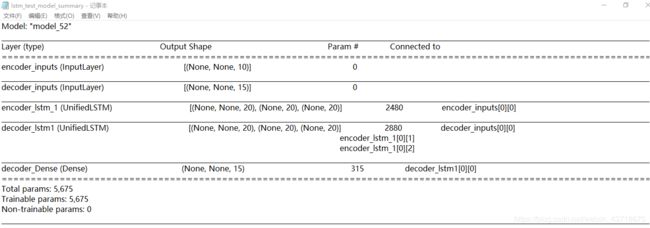
model的summary信息如下表:
包括四个信息,[layer_name,output_shape,params,connected_to],即[层名字,输出维度大小,参数数量,该层的输入和哪个层相连接],
sumarry中的参数line_length表示表长度,positions表示四个信息的位置(尾部位置)

上述代码默认summary在屏幕上输出,如果想将summary信息输出成文件,使用下列代码就行:
#这段代码用来将model.summary() 输出保存为文件
from contextlib import redirect_stdout
with open('model_summary.txt', 'w') as f:
    with redirect_stdout(f):
        model.summary(line_length=200,positions=[0.30,0.60,0.7,1.0])
在使用plot_model画结构图之前,需要安装一些必要的库
下面是一些教程,可以试试
https://blog.csdn.net/qq_27825451/article/details/89338222 重点
https://blog.csdn.net/sinat_36811967/article/details/79220235
https://blog.csdn.net/weixin_42442855/article/details/89554612 重点
总结下来就是 不要安装pydot,而是使用pydotplus库
安装pydotplus库需要graphviz库,这个库的安装,也可以使用下面教程
https://blog.csdn.net/weixin_43718675/article/details/88843534
#导入下面的库
from tensorflow.keras.utils import plot_model
import pydotplus

#参数 :模型名称,结构图保存位置,是否展示shape
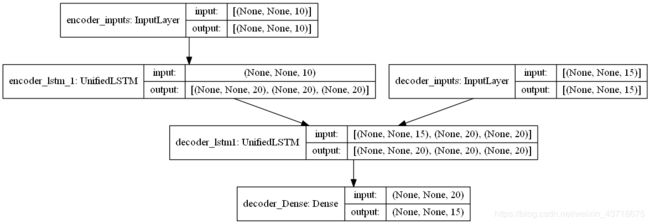
plot_model(lstm_test_model,to_file='lstm_test_model.png',show_shapes=True)
#输出所以层的名字,输入信息维度,输出信息维度
for layer in lstm_test_model.layers:
    print(layer.name)
    print(layer.input_shape)
    print(layer.output_shape)
    print()

