MIMIC数据库中数据的下载以及MATLAB读取
一、MIMIC数据库介绍
MIMIC数据库是美国麻省理工提供的一个对公众开放的多参数重症监护数据库,里面提供了诸如心电信号(ECG)、光电容积脉搏波信号(Pleth)、动脉血压信号(ABP)和呼吸信号(RESP)等从ICU病房中采集的生理数据。改数据库经过多个学科10多年的建设,目前已被成功运用于ICU临床数据挖掘的多个研究领域。
MIMIC中所有的数据资源经过严格的去处身份信息处理后,对全球研究人员免费开放,可以通过生理数据资源网站PhysioNet(http://physionet.org/)访问。详细的数据库介绍信息可以从网址得到:https://www.physionet.org/physiobank/database/mimicdb/
二、MIMIC数据库的下载
通过PhysioBank ATM对MIMIC数据库进行访问(网址:https://physionet.org/cgi-bin/atm/ATM)。在DataBase中选择MIMIC Database(mimicdb),如下如图所示: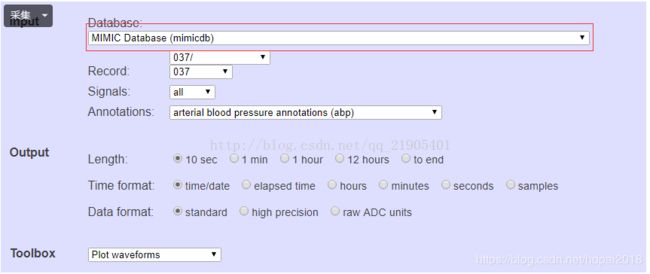
选择相应的Record样本(如055),以及输出时长 Output Length(如10 sec),在Toolbox中选择 Export signal as .mat,会有如下四个文件可供下载。其中.mat文件中存储信号数据、.info文件存储各路信号名字以及相应的其他信息、.hea文件是在相应软件中读取.mat文件所需要的数据文件,plotATM.m为所提供的用于从.mat和.info中读取数据的matlab代码,通过调用如plotATM(‘055m’)即可从中读取数据。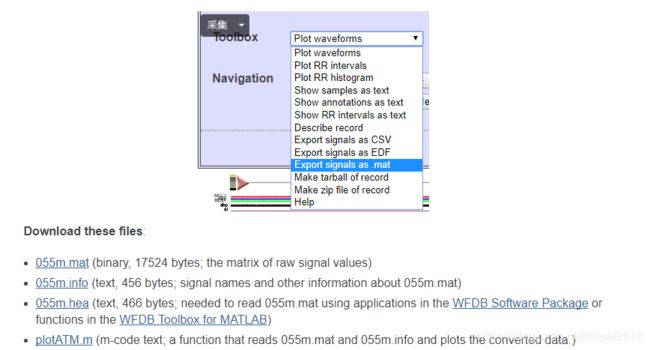 需要注意的:数据库中ECG采样率为500Hz,而PLETH和ABP等数据采用率为125Hz,而生成的.mat数据中,统一为125Hz,即将每路数据每4个取一次平均作为最后的数据。
plotATM.m代码如下:
function plotATM(Name)
usage: plotATM(‘RECORDm’)
This function reads a pair of files (RECORDm.mat and RECORDm.info) generated
by ‘wfdb2mat’ from a PhysioBank record, baseline-corrects and scales the time
series contained in the .mat file, and plots them. The baseline-corrected
and scaled time series are the rows of matrix ‘val’, and each
column contains simultaneous samples of each time series.
‘wfdb2mat’ is part of the open-source WFDB Software Package available at
http://physionet.org/physiotools/wfdb.shtml
If you have installed a working copy of ‘wfdb2mat’, run a shell command
such as
wfdb2mat -r 100s -f 0 -t 10 >100sm.info
to create a pair of files (‘100sm.mat’, ‘100sm.info’) that can be read
by this function.
The files needed by this function can also be produced by the
PhysioBank ATM, at
http://physionet.org/cgi-bin/ATM
plotATM.m O. Abdala 16 March 2009
James Hislop 27 January 2014 version 1.1
infoName = strcat(Name, ‘.info’);
matName = strcat(Name, ‘.mat’);
Octave = exist(‘OCTAVE_VERSION’);
load(matName);
fid = fopen(infoName, ‘rt’);
fgetl(fid);
fgetl(fid);
fgetl(fid);
[freqint] = sscanf(fgetl(fid), ‘Sampling frequency: %f Hz Sampling interval: %f sec’);
interval = freqint(2);
fgetl(fid);
if(Octave)
for i = 1:size(val, 1)
R = strsplit(fgetl(fid), char(9));
signal{i} = R{2};
gain(i) = str2num(R{3});
base(i) = str2num(R{4});
units{i} = R{5};
end
else
for i = 1:size(val, 1)
[row(i), signal(i), gain(i), base(i), units(i)]=strread(fgetl(fid),’%d%s%f%f%s’,‘delimiter’,’\t’);
end
end
fclose(fid);
val(val==-32768) = NaN;
for i = 1:size(val, 1)
val(i, = (val(i, - base(i)) / gain(i);
end
x = (1:size(val, 2)) * interval;
plot(x’, val’);
for i = 1:length(signal)
labels{i} = strcat(signal{i}, ’ (’, units{i}, ‘)’);
end
legend(labels);
xlabel(‘Time (sec)’);
% grid on
end