混合式应用真机调试(Android Studio + Chrome)
如何在chrome上调试混合式APP
https://developers.google.com/web/tools/chrome-devtools/remote-debugging/
Get Started with Remote Debugging Android Devices
Kayce Basques
By Kayce Basques
Technical Writer at Google
Remote debug live content on an Android device from your Windows, Mac, or Linux computer. This tutorial teaches you how to:
这篇教程教你如何在电脑上远程调试Android设备上正在运行的网页
Set up your Android device for remote debugging, and discover it from your development machine.
Inspect and debug live content on your Android device from your development machine.
Screencast content from your Android device onto a DevTools instance on your development machine.
remote debugging illustration
Requirements 要求
Chrome 32 or later installed on your development machine.
USB drivers installed on your development machine, if you’re using Windows. Ensure Device Manager reports the correct USB driver.
A USB cable to connect your Android device to your development machine.
Android 4.0 or later.
Chrome for Android installed on your Android device.
Step 1: Discover your Android device
On your Android device, select Settings > Developer Options > Enable USB Debugging. Developer Options is hidden by default on Android 4.2 and later. See Enabling On-Device Developer Options to learn how to enable it.
在Android设备上打开开发者模式
On your development machine, open Chrome. You should be signed in to Chrome with one of your Google accounts. Remote debugging does not work in Incognito Mode or Guest Mode.
打开谷歌浏览器并登陆谷歌账号(需要)
Open DevTools.
打开Chrome开发者工具(打开浏览器菜单–>更多工具–>开发者工具)
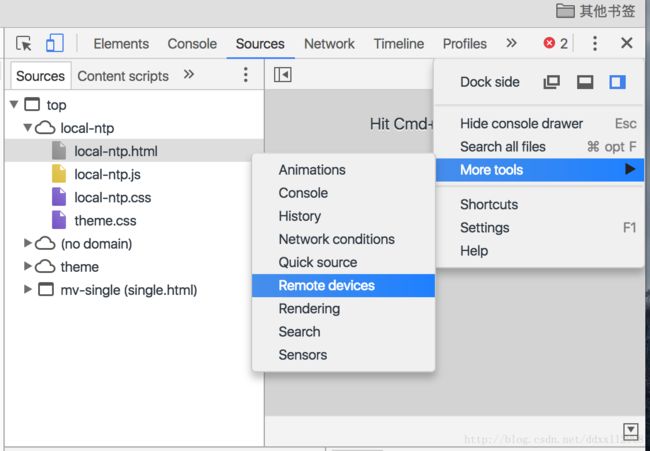
In DevTools, click the Main Menu Main Menu then select More tools > Remote devices.
在开发者工具中,点击主菜单,选择更多工具–>远程设备

Opening remote devices drawer
In DevTools, click the Settings tab, if another tab is showing.
Make sure that Discover USB devices is enabled.
Discover USB devices is enabled
Connect your Android device directly to your development machine using a USB cable. Don’t use any intermediate USB hubs. If this is your first time connecting your Android device to this development machine, your device shows up under Unknown, with the text Pending Authorization below it.
将你的Android设备直接连接到电脑上,不要使用USB集线器,如果你的Android设备是第一次连接到电脑上,名称应该是未知,需要授权允许连接。
Unknown device, pending authorization
未知设备等待授权
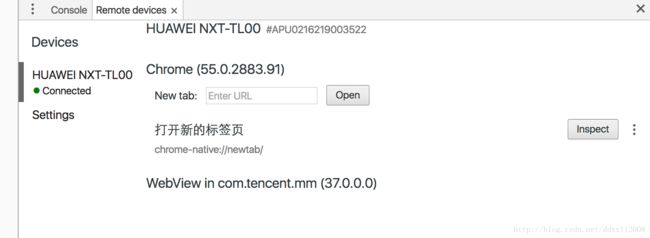
If your device is showing up as Unknown, accept the Allow USB Debugging permission prompt on your Android device. Unknown is replaced with the model name of your Android device. The green circle and the Connected text indicate that you are all set to remotely debug your Android device from your development machine.
Note: If you have any issues during the discovery process, you can restart it by selecting Settings > Developer Options > Revoke USB Debugging Authorizations on your Android device.
Step 2: Debug content on your Android device from your development machine
If you don’t already have Chrome open on your Android device, open it now.
在Android手机上打开Chrome
Back in DevTools, click the tab that matches your device’s model name. At the top of this page, you see your Android device’s model name, followed by its serial number. Below that, you can see the version of Chrome that’s running on the device, with the version number in parentheses. Each open Chrome tab gets its own section. You can interact with that tab from this section. If there are any apps using WebView, you see a section for each of those apps, too. The screenshot below does not have any tabs or WebViews open.
回到开发者工具,点击你设备名称的tab页,在顶部可以看到Android设备名称,后面是序列号。下面是Chrome版本号。每打开一个Chrome页面都会生成唯一的路径。你可以通过这个路径与页面进行交互。如果有任何apps使用了WebView,你可以看到对应app的路径。下图截屏中并未打开任何webview(这是原网站上的话,截屏未拷贝过来,下图中我打开了谷歌的首页,可以看到地址)。

Connected remote device
Next to New tab, enter a URL and then click Open. The page opens on a new tab on your Android device.
在新的tab页上,输入网址并打开,这个网址将在Android设备上打开。
Click Inspect next to the URL that you just opened. A new DevTools instance opens. The version of Chrome running on your Android device determines the version of DevTools that opens on your development machine. So, if your Android device is running a very old version of Chrome, the DevTools instance may look very different than what you’re used to.
点击网址后的检查按钮,一个新的开发者工具将会打开。你Android设备上的Chrome决定了新弹出的开发者工具的版本号。
More actions: reload, focus, or close a tab
Click More Options More Options next to the tab that you want to reload, focus, or close.
reload, focus, or close a tab
Inspect elements
Go to the Elements panel of your DevTools instance, and hover over an element to highlight it in the viewport of your Android device.
在开发者工具的元素面板,悬停在元素上,Android设备上的该元素会高亮显示。
You can also tap an element on your Android device screen to select it in the Elements panel. Click Select Element Select
Element on your DevTools instance, and then tap the element on your Android device screen. Note that Select Element is disabled after the first touch, so you need to re-enable it every time you want to use this feature.
你也可以在Android设备中点击元素,这样在元素面板就会选中。在开发者工具中点击元素选择(在元素页面tab左侧,一个小鼠标的图标),之后点击Android设备屏幕即可选中该元素。注意第一次选中元素之后,这种模式就会失效,每次选中元素前,都要点击元素选择图标。
Screencast from Android device to development machine
Click Toggle Screencast Toggle Screencast to view the content of your Android device in your DevTools instance.
点击截屏开关可以关闭/打开开发者工具中的Android设备屏幕预览。
You can interact with the screencast in multiple ways:
Clicks are translated into taps, firing proper touch events on the device.
Keystrokes on your computer are sent to the device.
To simulate a pinch gesture, hold Shift while dragging.
To scroll, use your trackpad or mouse wheel, or fling with your mouse pointer.
Some notes on screencasts:
Screencasts only display page content. Transparent portions of the screencast represent device interfaces, such as the Chrome omnibox, the Android status bar, or the Android keyboard.
截屏只显示页面内容,透明的部分表示设备接口,比如Chrome多功能框,Android status bar或Android键盘。
Screencasts negatively affect frame rates. Disable screencasting while measuring scrolls or animations to get a more accurate picture of your page’s performance.
截屏会降低框架的效率,所以测试滑动和动画效果时,最好关闭截屏,来获取更精确的页面效果。
If your Android device screen locks, the content of your screencast disappears. Unlock your Android device screen to automatically resume the screencast.
注意
需要在Android上打开debug模式
从 Android 4.4 开始,webkit是支持远程调试的,不过需要将app的debug模式打开,可以使用如下代码:
WebView.setWebContentsDebuggingEnabled(true);
由于大部分 App 的 debug 模式是关闭的,即便是内部 App,比如 QQ/微信,要去找一个开启了debug 模式的版本还是比较麻烦的。因此需要使用借助第三方工具来强制开启任何 App 的 Android webview debug模式,使之可以使用 chrome inspect。而这个工具就是 Xposed 。具体参考:http://imweb.io/topic/56b768ed5c49f9d377ed8ef2