Matlab画图求助,好几个图放在一个坐标系里的那种图。
@[TOC]Matlab画图求助,好几个图放在一个坐标系里的那种图。
第一次使用这个网站,不知道提问是不是这样操作的。。
这是我自己用一些很奇怪的方法画出来的,很不好看,而且很乱。总觉得matlab里应该有类似的画这种图的功能,但我百度了,没咋找到(脸红)。希望有人能指点指点。
图中的坐标轴颜色不一样,而且是好几个坐标轴重叠覆盖的,看着特别奇怪。
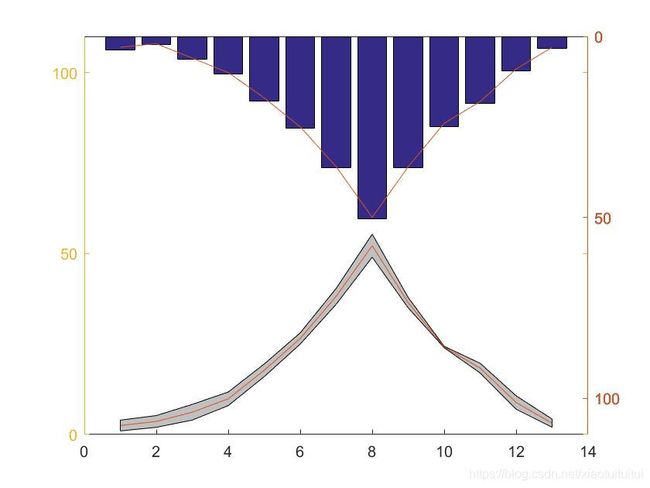
以下是我画这个图的代码
clear
a = load(‘trypic.txt’);
mon = [1 2 3 4 5 6 7 8 9 10 11 12 13];
mi = a(:,1);
ma = a(:,2);
me = (mi+ma)/2;
et = a(:,3);
pr = a(:,4);
k = 110;
fill([mon,fliplr(mon)],[mi’,fliplr(ma’)],[192/255,192/255,192/255]);
set(gca,‘YLim’,[0,k]);
hold on
[hAxes,hLine,hbar]=plotyy(mon,me,mon,et,‘plot’,‘bar’);
set(hAxes(2),‘YDir’,‘reverse’);
set(hAxes(1),‘YLim’,[0,k]);
set(hAxes(2),‘YTick’,[0,50,100,150]);
set(hAxes(2),‘YLim’,[0,k]);
set(hAxes(2),‘YTick’,[0,50,100,150]);
[hAxes,hLine,hbar]=plotyy([0],[0],mon,pr,‘plot’,‘plot’);
set(hAxes(1),‘YLim’,[0,k]);
set(hAxes(2),‘YDir’,‘reverse’);
set(hAxes(2),‘YLim’,[0,k]);
set(hAxes(2),‘YTick’,[0,50,100,150]);
然后那个trypic.txt里的数据是这样的
1 3.988775482 3.694978202 3
2 5.247275659 2.199633701 2
4 8.342733448 6.399459232 6
8 11.7650693 10.31217078 10
16 19.50314764 17.90717912 17
25 28.10005097 25.34822508 25
36 40.40035156 36.29654103 36
49 55.3664918 50.30428742 50
35 37.87039424 36.16778395 36
24 24.37727025 24.94923823 24
17 19.69592784 18.41366256 18
7 10.70157442 9.598950718 9
2 4.27955596 3.361135611 3
多谢