Sipakmed:a new dataset feature and image based classification of cervical cells——记一次复现论文经历(一)
cell features
一、数据总览
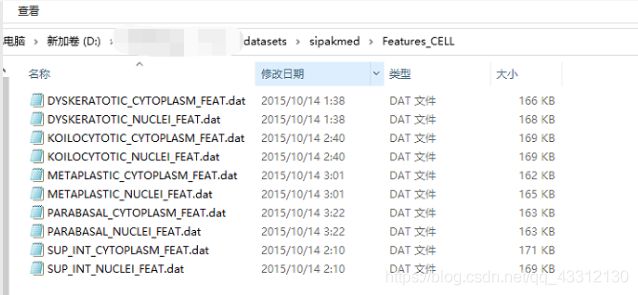
首先看一下数据文件。五类细胞分为细胞质和细胞核特征。
每个dat文件有28列,其中,第一列是这个特征所属的细胞块图像编号,第二列是该细胞块图像的细胞编号(一张细胞块图像里有多个细胞),这两列不属于特征,所以在训练的时候要把这两列去掉。

二、制作Libsvm数据集
细胞特征的数据是直接输入到svm去分类,现在libsvm第三方库十分方便,只不过需要把输入转化成他要求的格式才行。
2.1 dat文件转化位txt文件
def makeLibsvmData():

	#这个函数是把上图所示的dat文件转化成txt,并且把第一二列去掉了

	#修改path!!!
    path = "your path/datasets/sipakmed/Features_CELL"
    files = os.listdir(path)
    for file in files:
        if file[-3:]=='dat':
            file_path = path+"/"+file
            f_r = open(file_path,'r')
            f_w = open(file_path[0:-3]+"txt",'w')
            rows = f_r.readlines()
            for row in rows:
                row = row.split(",")
                # print(len(row))


                #去掉第一二列
                row.__delitem__(0)
                row.__delitem__(0)
                row[-1] = row[-1][0:-1]
                print(len(row))
                row.append(class_to_index[file[0]])
                print(len(row))

                # print(row)
                for item in row:
                    f_w.write(item+' ')
                f_w.write('\n')
调用这个函数的结果类似于下图的格式,每一类细胞的细胞质细胞核特征都会生成一个txt文件,所以总共是10个txt文件。
2.2 把五类细胞的细胞核/质特征txt文件合为一个txt文件
def makeLibsvmDataTXT():
    path = "your path/datasets/sipakmed/Features_CELL"
    LibsvmDataTXTCYTOPLASM = open('your path/datasets/sipakmed/Features_CELL/LibsvmData_CYTOPLASM.txt','w')
    LibsvmDataTXTNUCLEI = open('your pathw/datasets/sipakmed/Features_CELL/LibsvmData_NUCLEI.txt', 'w')

    files = os.listdir(path)
    for file in files:
        if file[-3:]=='txt' and file.__contains__("FEAT"):
            f = open(path+'/'+file,'r')
            rows = f.readlines()
            for row in rows:
                if file.__contains__("CYTOPLASM"):
                    LibsvmDataTXTCYTOPLASM.write(row)
                else:
                    LibsvmDataTXTNUCLEI.write(row)
调用这个函数的结果是这样。只有两个txt文件夹
2.3 利用FormatDataLibsvm.xls文件生成libsvm格式的数据
- 准备工作:下载包、路径设置、测试代码等。具体看下面这个博客,很详细。
- 用
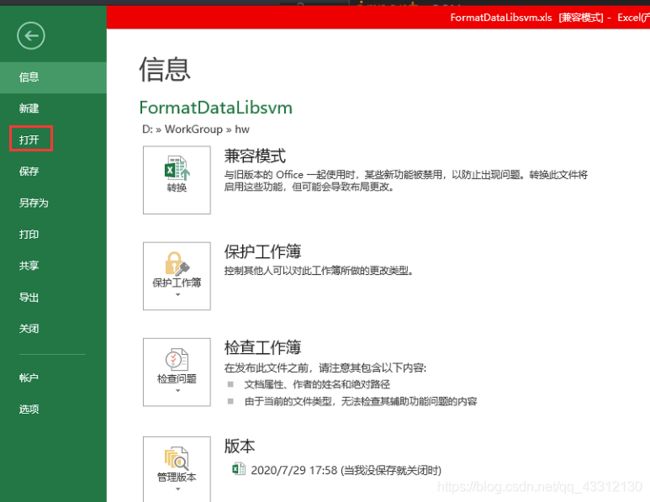
FormatDataLibsvm.xls打开LibsvmData_CYTOPLASM.txt(上面那一步生成的细胞质特征文件),然后点击菜单栏的开发工具,点宏,再点执行,等待即可。最后另存为csv文件。
2.4 将libsvm格式的csv文件转化为txt文件
def makeLibsvmDataTXTfromCSV():
    path = "your path/datasets/sipakmed/Features_CELL"
    CYTOPLASM = csv.reader(open(path+'/'+'FormatDataLibsvmCYTOPLASM.csv','r',encoding='unicode_escape'))
    CYTOPLASMtxt = open(path+'/'+'LibsvmDatafromCSV_CYTOPLASM.txt','w')
    NUCLEI = csv.reader(open(path + '/' + 'FormatDataLibsvmNUCLEI.csv', 'r', encoding='unicode_escape'))
    NUCLEItxt = open(path + '/' + 'LibsvmDatafromCSV_NUCLEI.txt', 'w')
    # print(csv_reader)
    for row in CYTOPLASM:
        # print(len(row[1]))
        for index,item in enumerate(row):
            if index ==0:
                CYTOPLASMtxt.write(item)
            else:
                CYTOPLASMtxt.write(item[1:])
            CYTOPLASMtxt.write(" ")
        CYTOPLASMtxt.write('\n')
    for row in NUCLEI:
        # print(len(row[1]))
        for index,item in enumerate(row):
            if index ==0:
                NUCLEItxt.write(item)
            else:
                NUCLEItxt.write(item[1:])
            NUCLEItxt.write(" ")
        NUCLEItxt.write('\n')
2.5 根据五折,生训练测试数据
def func(listTemp, n):
    for i in range(0, len(listTemp), n):
        yield listTemp[i:i + n]
def makeTrainTestTxt(path):
    n =5
    file = open(path,'r')
    rows = []
    for row in file.readlines():
        rows.append(row)
    total = len(rows)
    random.shuffle(rows)
    f = func(rows, (int)(total / n))
    f = list(f)

    for index,i in enumerate(f):
        if index !=5:
            if path.__contains__("NUCLEI"):
                trainFile = open("your path\\datasets\\sipakmed\\Features_CELL\\train_test\\NUCLEI\\train" + str(index) + ".txt", 'w')
                testFile = open("yout path\\datasets\\sipakmed\\Features_CELL\\train_test\\NUCLEI\\test" + str(index) + ".txt", 'w')

            else:
                trainFile = open(
                    "your path\\datasets\\sipakmed\\Features_CELL\\train_test\\CYTOPLASM\\train" + str(
                        index) + ".txt", 'w')
                testFile = open("your path\\datasets\\sipakmed\\Features_CELL\\train_test\\CYTOPLASM\\test" + str(
                    index) + ".txt", 'w')
            test = i
            train = []
            for k in f:
                if k != i:
                    train.append(k)
            for j in test:
                testFile.write(j)
            for item in train:
                for j in item:
                    trainFile.write(j)
三、训练
3.1 首先找到最佳c和g
终端进入libsvm包的tools目录下

输入如下命令:
python grid.py "your path/datasets/sipakmed/Features_CELL/train_test/CYTOPLASM/train0.txt"
执行结束后最后一行有三个数字,第一个是最优参数c,第二个是最优参数g,由于有五个训练集,理论上要运行五次,但实际上各个训练集其实相差不是很大,所以最优参都是一样的。把这些参数保存到parametersC这个列表里。
import sys

from plot_confusion_matrix import plot_confusion_matrix

path = "your path\sipakmed\libsvm-3.24\python"
sys.path.append(path)
import os
os.chdir(path)
import numpy as np
from svmutil import *
parametersC=['-c 8.0 -g 0.000030517578125',
              '-c 8.0 -g 0.000030517578125',
              '-c 8.0 -g 0.000030517578125',
              '-c 8.0 -g 0.000030517578125',
              '-c 8.0 -g 0.000030517578125',]

def trainC():
    confusion_matricesC = []
    accuracyC = []
    for i in range(5):
        train_path = 'your path/datasets/sipakmed/Features_CELL/train_test/CYTOPLASM/train' + str(i) + '.txt'
        print(train_path)
        y, x = svm_read_problem(
            'your path/datasets/sipakmed/Features_CELL/train_test/CYTOPLASM/train' + str(i) + '.txt')
        y1, x1 = svm_read_problem(
            'your path/datasets/sipakmed/Features_CELL/train_test/CYTOPLASM/test' + str(i) + '.txt')
        m = svm_train(y, x, parametersC[i])
        print('----------------')
        lable, acc, val = svm_predict(y1, x1, m)

        confusion_matrix = np.zeros((5, 5))

        lable = np.array(lable)
        y1 = np.array(y1)
        correct = 0
        for k in range(y1.size):
            if (lable[k] == y1[k]):
                correct = correct + 1
            confusion_matrix[int(y1[k])][int(lable[k])] = confusion_matrix[int(y1[k])][int(lable[k])] + 1
        accuracyC.append(correct / y1.size * 100)
        confusion_matricesC.append(confusion_matrix)
    for i, item in enumerate(accuracyC):
        print("exp ", i, "| accracy: ", item)
    cm = np.zeros((5, 5))
    for i in confusion_matricesC:
        cm = cm + np.array(i)
    cm = cm / 5
    classes = ['Dyskeratotic', 'Koilocytotic', 'Metaplastic', 'Parabasal', 'Sup-Inter']
    plot_confusion_matrix(cm=cm, saveName="libsvm-cytoplasm-cm.png", classes=classes, normalize=True)
plot_confusion_matrix.py
import itertools
import matplotlib.pyplot as plt
import numpy as np
# 绘制混淆矩阵
def plot_confusion_matrix(cm, classes, saveName,normalize=False, title='Confusion matrix', cmap=plt.cm.Blues):
    """
    This function prints and plots the confusion matrix.
    Normalization can be applied by setting `normalize=True`.
    Input
    - cm : 计算出的混淆矩阵的值
    - classes : 混淆矩阵中每一行每一列对应的列
    - normalize : True:显示百分比, False:显示个数
    """
    if normalize:
        cm = cm.astype('float') / cm.sum(axis=1)[:, np.newaxis]
        print("Normalized confusion matrix")
    else:
        print('Confusion matrix, without normalization')
    print(cm)
    plt.imshow(cm, interpolation='nearest', cmap=cmap)
    plt.title(title)
    plt.colorbar()
    tick_marks = np.arange(len(classes))
    plt.xticks(tick_marks, classes, rotation=45)
    plt.yticks(tick_marks, classes)
    fmt = '.2f' if normalize else 'd'
    thresh = cm.max() / 2.
    for i, j in itertools.product(range(cm.shape[0]), range(cm.shape[1])):
        plt.text(j, i, format(cm[i, j], fmt),
                 horizontalalignment="center",
                 color="white" if cm[i, j] > thresh else "black")
    plt.tight_layout()
    plt.ylabel('True label')
    plt.xlabel('Predicted label')
    plt.show()
    plt.savefig(saveName)
    # plt.show()
训练细胞核也是类似的,把路径改一下就行了


