使用valgrind测试gluster fuse内存泄漏问题
一、valgrind
(一)介绍
Valgrind是一个开源的工具,用于构建动态分析工具的探测框架,包括memcheck,addrcheck,cachegrind,Massif,helgrind和Callgrind等工具,每个工具执行某种类型的调试、分析或类似的任务,以帮助程序员完善自己的程序。
(二)常用参数
valgrind命令格式:
valgrind [valgrind-options] your-prog [your-prog options]1、--leak-check=
用于控制内存泄漏检测力度。no,不检测内存泄漏;summary,仅报告总共泄漏的数量,不报告具体泄漏位置; yes/full,报告泄漏总数、泄漏的具体位置。
2、--show-reachable=
用于控制是否检测控制范围之外的泄漏,比如全局指针、static指针等。若--show-reachable为no,则valgrind不报告内存泄漏,否则会报告。
3、--undef-value-errors=
用于控制是否检测代码中使用未初始化变量的情况。 --undef-value-errors=no,则valgrind不报告错误,否则报告“Use of uninitialised value ...”的错误。
4、其他选项
--log-file=filename
--log-socket=172.18.0.16:3242
--trace-children=
--track-fds=
--log-fd=
--xml=
--num-callers=
--show-below-main=
二、编译glusterfs
使用valgrind检查时,如果需要更详细的报告,如哪一行代码出现内存泄漏等,则需要在编译程序的时候打开调试模式(gcc编译器的-g选项)。如果没有调试信息,即使最好的valgrind工具也将中能够猜测特定的代码是属于哪一个函数。一些编译优化选项(比如-O2或者更高的优化选项),可能会使得memcheck提交错误的未初始化报告,因此,为了使得valgrind的报告更精确,在编译的时候最好不要使用优化选项。
从gluster官网上下载glusterfs-4.1.4,源码从新编译安装。
编译命令为:
# rpmbuild -ta SOURCES/glusterfs-4.1.4.tar.gz --with=debug --without=rdma三、安装部署测试环境
(一)测试环境
| 软件 |
版本 |
服务器内存 |
| Gluster |
4.1.4 |
94G |
| Valgrind | 3.13.0 |
(二)测试环境部署
设置环境变量:
# export CFLAGS='-O0'创建gluster卷并启动卷
[root@ZS-ISP ~]# gluster v info vol

Volume Name: vol
Type: Distribute
Volume ID: 256659a4-3cdd-4033-b05a-192a020faa48
Status: Started
Snapshot Count: 0
Number of Bricks: 1
Transport-type: tcp
Bricks:
Brick1: 172.18.0.16:/home/v1
Options Reconfigured:
transport.address-family: inet
nfs.disable: on
修改/usr/sbin/mount.glusterfs 配置文件,把
cmd_line=$(echo "/usr/sbin/glusterfs");改为,glusterfs的参数--no-daemon,表示禁止后台运行。
cmd_line=$(echo "valgrind --tool=memcheck --leak-check=full --show-leak-kinds=all --log-file=/var/log/valgrind.log /usr/sbin/glusterfs --no-daemon");四、开始测试
测试方法:使用脚本运行dd命令生成1k大小的文件,共一千个进程不断生成,测试使用top命令以及valgrind查看glusterfs进程占用内存情况。
(一)编写测试脚本
[root@ZS-ISP ~]# cat small_file.sh
#! /bin/bash
prefix=$1
index=0
while true
do
    dd if=/dev/zero bs=1K count=11 of=/mnt/test/test-$prefix+{$index}
    let index+=1
done
You have new mail in /var/spool/mail/root
[root@ZS-ISP ~]# cat test.sh
#! /bin/bash
for i in {1..1000}
do
    ./small_file.sh $i >/dev/null 2>&1 &
done
(2)挂载卷
[root@ZS-ISP ~]# mount -t glusterfs localhost:vol /mnt/test
查看运行的进程
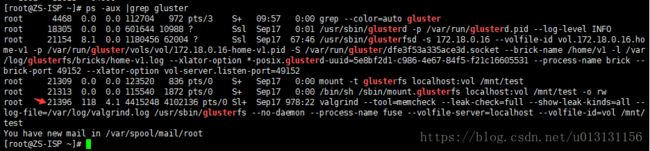
(三)运行测试脚本
[root@ZS-ISP ~]# ./test.sh
[root@ZS-ISP ~]# ps -axu |grep small_file.sh |wc
   1001   13013   94990
五、测试脚本运行15个小时后,查看测试结果
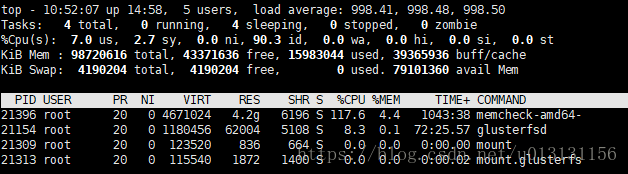
(一)使用top查看
运行过程中发现21396进程RES不断增大。

(二)查看valgrind日志
==21396== Memcheck, a memory error detector
==21396== Copyright (C) 2002-2017, and GNU GPL'd, by Julian Seward et al.
==21396== Using Valgrind-3.13.0 and LibVEX; rerun with -h for copyright info
==21396== Command: /usr/sbin/glusterfs --no-daemon --process-name fuse --volfile-server=localhost --volfile-id=vol /mnt/test
==21396== Parent PID: 21313
==21396==
==22000==
==22000== HEAP SUMMARY:
==22000==     in use at exit: 331,528 bytes in 79 blocks
==22000==   total heap usage: 169 allocs, 90 frees, 349,091 bytes allocated
==22000==
==22000== 8 bytes in 1 blocks are still reachable in loss record 1 of 65
==22000==    at 0x4C2B9B5: calloc (vg_replace_malloc.c:711)
==22000==    by 0x4EA142D: __gf_default_calloc (mem-pool.h:118)
==22000==    by 0x4EA1852: __glusterfs_this_location (globals.c:255)
==22000==    by 0x1154EA: main (glusterfsd.c:2680)
==22000==
==22000== 32 bytes in 1 blocks are still reachable in loss record 2 of 65
==22000==    at 0x4C2B9B5: calloc (vg_replace_malloc.c:711)
==22000==    by 0x5EE561F: _dlerror_run (in /usr/lib64/libdl-2.17.so)
==22000==    by 0x5EE5050: dlopen@@GLIBC_2.2.5 (in /usr/lib64/libdl-2.17.so)
==22000==    by 0x4E5BECB: xlator_dynload (xlator.c:449)
==22000==    by 0x4E5C133: xlator_set_type (xlator.c:515)
==22000==    by 0x1107C8: create_fuse_mount (glusterfsd.c:699)
==22000==    by 0x1157A5: main (glusterfsd.c:2748)
==22000==
==22000== 48 bytes in 1 blocks are still reachable in loss record 3 of 65
==22000==    at 0x4C29C23: malloc (vg_replace_malloc.c:299)
==22000==    by 0x4007B8C: expand_dynamic_string_token (in /usr/lib64/ld-2.17.so)
==22000==    by 0x400871E: _dl_map_object (in /usr/lib64/ld-2.17.so)
==22000==    by 0x40143E3: dl_open_worker (in /usr/lib64/ld-2.17.so)
==22000==    by 0x400F913: _dl_catch_error (in /usr/lib64/ld-2.17.so)
==22000==    by 0x4013CCA: _dl_open (in /usr/lib64/ld-2.17.so)
==22000==    by 0x5EE4FBA: dlopen_doit (in /usr/lib64/libdl-2.17.so)
==22000==    by 0x400F913: _dl_catch_error (in /usr/lib64/ld-2.17.so)
==22000==    by 0x5EE55BC: _dlerror_run (in /usr/lib64/libdl-2.17.so)
==22000==    by 0x5EE5050: dlopen@@GLIBC_2.2.5 (in /usr/lib64/libdl-2.17.so)
==22000==    by 0x4E5BECB: xlator_dynload (xlator.c:449)
==22000==    by 0x4E5C133: xlator_set_type (xlator.c:515)
==22000==
==22000== 48 bytes in 1 blocks are still reachable in loss record 4 of 65
==22000==    at 0x4C29C23: malloc (vg_replace_malloc.c:299)
==22000==    by 0x400B603: _dl_new_object (in /usr/lib64/ld-2.17.so)
==22000==    by 0x40062F3: _dl_map_object_from_fd (in /usr/lib64/ld-2.17.so)
==22000==    by 0x40087B7: _dl_map_object (in /usr/lib64/ld-2.17.so)
==22000==    by 0x40143E3: dl_open_worker (in /usr/lib64/ld-2.17.so)
==22000==    by 0x400F913: _dl_catch_error (in /usr/lib64/ld-2.17.so)
==22000==    by 0x4013CCA: _dl_open (in /usr/lib64/ld-2.17.so)
==22000==    by 0x5EE4FBA: dlopen_doit (in /usr/lib64/libdl-2.17.so)
==22000==    by 0x400F913: _dl_catch_error (in /usr/lib64/ld-2.17.so)
==22000==    by 0x5EE55BC: _dlerror_run (in /usr/lib64/libdl-2.17.so)
==22000==    by 0x5EE5050: dlopen@@GLIBC_2.2.5 (in /usr/lib64/libdl-2.17.so)
==22000==    by 0x4E5BECB: xlator_dynload (xlator.c:449)
。。。。。。
。。。。。。
。。。。。。
==21396== 254,650,968 bytes in 964,587 blocks are possibly lost in loss record 737 of 739
==21396==    at 0x4C2B9B5: calloc (vg_replace_malloc.c:711)
==21396==    by 0x4E991DB: __gf_calloc (mem-pool.c:115)
==21396==    by 0x13E0E66B: __wb_inode_create (write-behind.c:640)
==21396==    by 0x13E0E891: wb_inode_create (write-behind.c:678)
==21396==    by 0x13E126DD: wb_writev (write-behind.c:1791)
==21396==    by 0x1402CA41: ra_writev (read-ahead.c:684)
==21396==    by 0x4F3F2B4: default_writev (defaults.c:2685)
==21396==    by 0x1444DAD9: ioc_writev (io-cache.c:1267)
==21396==    by 0x14664537: qr_writev (quick-read.c:666)
==21396==    by 0x4F34BFA: default_writev_resume (defaults.c:1949)
==21396==    by 0x4E82B10: call_resume_wind (call-stub.c:2206)
==21396==    by 0x4E94B9E: call_resume (call-stub.c:2689)
==21396==
==21396== 262,367,664 bytes in 964,587 blocks are possibly lost in loss record 738 of 739
==21396==    at 0x4C2B9B5: calloc (vg_replace_malloc.c:711)
==21396==    by 0x4E991DB: __gf_calloc (mem-pool.c:115)
==21396==    by 0x14EBA969: ios_init_iosstat (io-stats.c:1964)
==21396==    by 0x14EBAC04: io_stats_create_cbk (io-stats.c:2025)
==21396==    by 0x4F27617: default_create_cbk (defaults.c:1255)
==21396==    by 0x14A863D0: mdc_create_cbk (md-cache.c:1852)
==21396==    by 0x144498F0: ioc_create_cbk (io-cache.c:708)
==21396==    by 0x14028006: ra_create_cbk (read-ahead.c:173)
==21396==    by 0x13B9EA5A: dht_create_cbk (dht-common.c:8162)
==21396==    by 0x138E8696: client4_0_create_cbk (client-rpc-fops_v2.c:2048)
==21396==    by 0x5186E86: rpc_clnt_handle_reply (rpc-clnt.c:776)
==21396==    by 0x5187436: rpc_clnt_notify (rpc-clnt.c:984)
==21396==
==21396== 486,152,856 bytes in 964,589 blocks are possibly lost in loss record 739 of 739
==21396==    at 0x4C2B9B5: calloc (vg_replace_malloc.c:711)
==21396==    by 0x4E991DB: __gf_calloc (mem-pool.c:115)
==21396==    by 0x4E73FFC: __inode_create (inode.c:652)
==21396==    by 0x4E74123: inode_new (inode.c:685)
==21396==    by 0xDF72184: fuse_create_resume (fuse-bridge.c:2202)
==21396==    by 0xDF66F7B: fuse_fop_resume (fuse-bridge.c:650)
==21396==    by 0xDF64124: fuse_resolve_done (fuse-resolve.c:663)
==21396==    by 0xDF641FA: fuse_resolve_all (fuse-resolve.c:690)
==21396==    by 0xDF64105: fuse_resolve (fuse-resolve.c:654)
==21396==    by 0xDF641D1: fuse_resolve_all (fuse-resolve.c:686)
==21396==    by 0xDF64258: fuse_resolve_continue (fuse-resolve.c:706)
==21396==    by 0xDF622CE: fuse_resolve_entry_cbk (fuse-resolve.c:76)
==21396==
==21396== LEAK SUMMARY:
==21396==    definitely lost: 256 bytes in 1 blocks
==21396==    indirectly lost: 0 bytes in 0 blocks
==21396==      possibly lost: 2,198,738,530 bytes in 9,700,592 blocks
==21396==    still reachable: 1,491,296 bytes in 2,458 blocks
==21396==         suppressed: 0 bytes in 0 blocks
==21396==
==21396== For counts of detected and suppressed errors, rerun with: -v
==21396== Use --track-origins=yes to see where uninitialised values come from
==21396== ERROR SUMMARY: 1112810 errors from 445 contexts (suppressed: 0 from 0)
左边显示类似行号的数字(21396)表示的是 Process ID。最开始的是 valgrind 的版本信息。中间是valgrind 通过运行被测试程序,发现的内存问题。Memcheck将内存泄露分为两种,一种是可能的内存泄露(Possibly lost),另外一种是确定的内存泄露(Definitely lost)。Possibly lost 是指仍然存在某个指针能够访问某块内存,但该指针指向的已经不是该内存首地址。Definitely lost 是指已经不能够访问这块内存。而Definitely lost又分为两种:直接的(direct)和间接的(indirect)。直接和间接的区别就是,直接是没有任何指针指向该内存,间接是指指向该内存的指针都位于内存泄露处。在上述的例子中,根节点是directly lost,而其他节点是indirectly lost。使用top命令查看发现pid为21396的进程RES占用4.2G,valgrind 显示possibly lost 2个多g,表明gluster使用fuse客户端在存储海量小文件时具有内存泄漏。