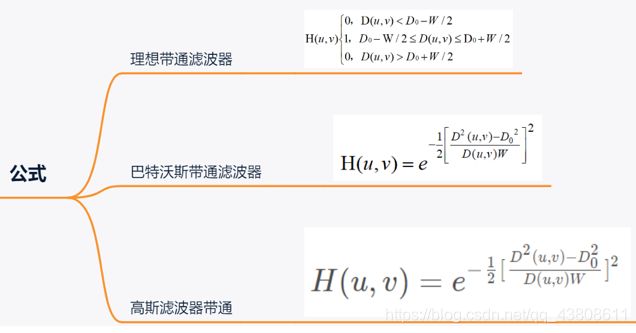
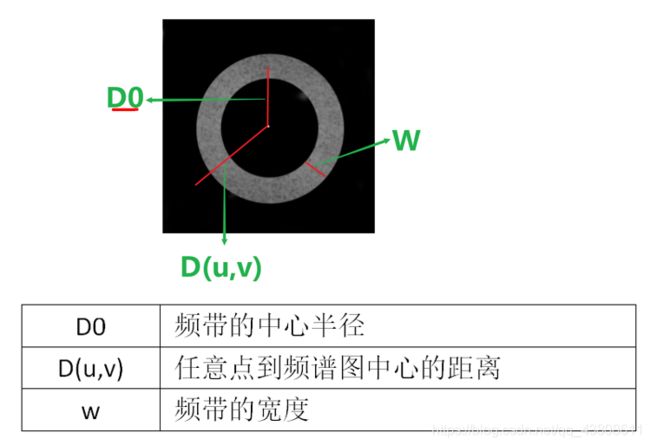
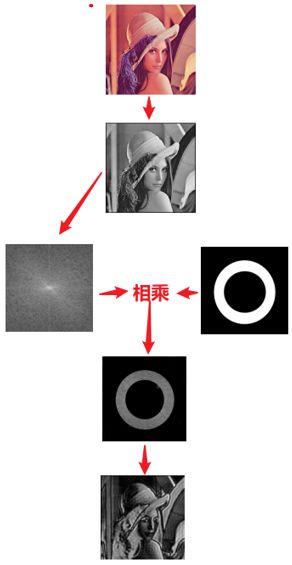
带通滤波器
import cv2
import numpy as np
import math
from matplotlib import pyplot as plt
img = cv2.imread('C:/Users/lenovo/Desktop/lena.jpg', 0)
def ideal_bandpass_filter(img,D0,w):
img_float32 = np.float32(img)
dft = cv2.dft(img_float32, flags=cv2.DFT_COMPLEX_OUTPUT)
dft_shift = np.fft.fftshift(dft)
rows, cols = img.shape
crow, ccol = int(rows / 2), int(cols / 2)
mask = np.ones((rows, cols,2), np.uint8)
for i in range(0, rows):
for j in range(0, cols):
d = math.sqrt(pow(i - crow, 2) + pow(j - ccol, 2))
if D0 - w / 2 < d < D0 + w / 2:
mask[i, j,0]=mask[i,j,1] = 1
else:
mask[i, j,0]=mask[i,j,1] = 0
f = dft_shift * mask
ishift = np.fft.ifftshift(f)
iimg = cv2.idft(ishift)
res = cv2.magnitude(iimg[:, :, 0], iimg[:, :, 1])
return res
new_image1=ideal_bandpass_filter(img,D0=6,w=10)
new_image2=ideal_bandpass_filter(img,D0=15,w=10)
new_image3=ideal_bandpass_filter(img,D0=25,w=10)
title=['Source Image','D0=6','D0=15','D0=25']
images=[img,new_image1,new_image2,new_image3]
for i in np.arange(4):
plt.subplot(2,2,i+1),plt.imshow(images[i],'gray')
plt.title(title[i])
plt.xticks([]),plt.yticks([])
plt.show()
import cv2
import numpy as np
from matplotlib import pyplot as plt
def butterworth_bandstop_kernel(img,D0,W,n=1):
assert img.ndim == 2
r,c = img.shape[1],img.shape[0]
u = np.arange(r)
v = np.arange(c)
u, v = np.meshgrid(u, v)
low_pass = np.sqrt( (u-r/2)**2 + (v-c/2)**2 )
kernel = 1-(1/(1+((low_pass*W)/(low_pass**2-D0**2))**(2*n)))
return kernel
def butterworth_bandpass_filter(img,D0,W,n):
assert img.ndim == 2
kernel = butterworth_bandstop_kernel(img,D0,W,n)
gray = np.float64(img)
gray_fft = np.fft.fft2(gray)
gray_fftshift = np.fft.fftshift(gray_fft)
dst_filtered = kernel * gray_fftshift
dst_ifftshift = np.fft.ifftshift(dst_filtered)
dst_ifft = np.fft.ifft2(dst_ifftshift)
dst = np.abs(np.real(dst_ifft))
dst = np.clip(dst,0,255)
return np.uint8(dst)
img = cv2.imread('C:/Users/lenovo/Desktop/lena.jpg', 0)
new_image1=butterworth_bandpass_filter(img,D0=6,W=10,n=1)
new_image2=butterworth_bandpass_filter(img,D0=15,W=10,n=1)
new_image3=butterworth_bandpass_filter(img,D0=25,W=10,n=1)
title=['Source Image','D0=6','D0=15','D0=25']
images=[img,new_image1,new_image2,new_image3]
for i in np.arange(4):
plt.subplot(2,2,i+1),plt.imshow(images[i],'gray')
plt.title(title[i])
plt.xticks([]),plt.yticks([])
plt.show()
import cv2
import numpy as np
from matplotlib import pyplot as plt
def gaussian_bandstop_kernel(img,D0,W):
assert img.ndim == 2
r,c = img.shape[1],img.shape[0]
u = np.arange(r)
v = np.arange(c)
u, v = np.meshgrid(u, v)
low_pass = np.sqrt( (u-r/2)**2 + (v-c/2)**2 )
kernel = 1.0 - np.exp(-0.5 * (((low_pass ** 2 - D0**2) / (low_pass *W + 1.0e-5))**2))
return kernel
def gaussian_bandpass_filter(img,D0=5,W=10):
assert img.ndim == 2
kernel = 1.0 - gaussian_bandstop_kernel(img,D0,W)
gray = np.float64(img)
gray_fft = np.fft.fft2(gray)
gray_fftshift = np.fft.fftshift(gray_fft)
dst = np.zeros_like(gray_fftshift)
dst_filtered = kernel * gray_fftshift
dst_ifftshift = np.fft.ifftshift(dst_filtered)
dst_ifft = np.fft.ifft2(dst_ifftshift)
dst = np.abs(np.real(dst_ifft))
dst = np.clip(dst,0,255)
return np.uint8(dst)
img = cv2.imread('C:/Users/lenovo/Desktop/4.png', 0)
new_image1=gaussian_bandpass_filter(img,D0=6,W=10)
new_image2=gaussian_bandpass_filter(img,D0=15,W=10)
new_image3=gaussian_bandpass_filter(img,D0=25,W=10)
title=['Source Image','D0=6','D0=15','D0=25']
images=[img,new_image1,new_image2,new_image3]
for i in np.arange(4):
plt.subplot(2,2,i+1),plt.imshow(images[i],'gray')
plt.title(title[i])
plt.xticks([]),plt.yticks([])
plt.show()
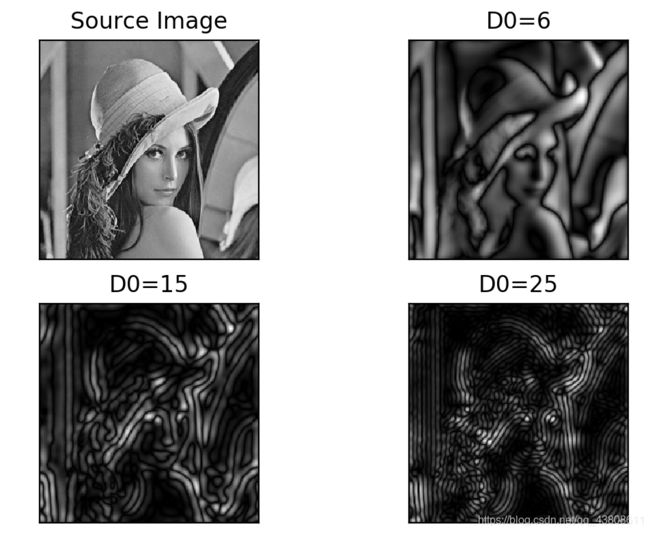
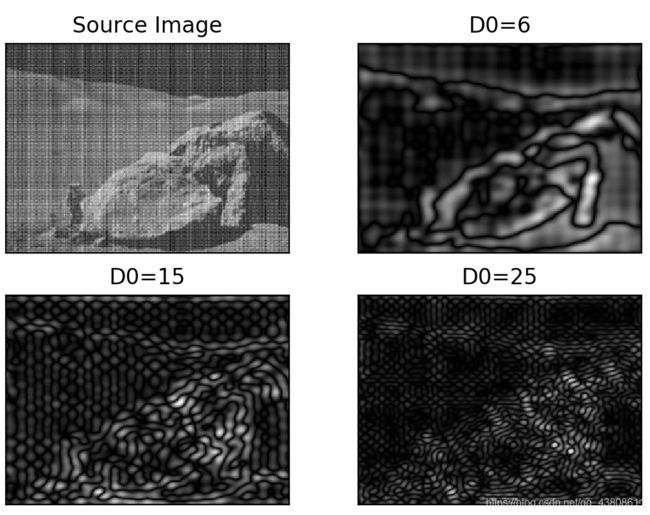
- 实验结果
处理正常图像
处理噪声图像
- 实验结论
1、不可以直接使用带通滤波器,如果直接使用会损失大量图像细节
2、可使用带通滤波器提取噪声模式
