antv/g6-editor的使用详解
在angular中使用@antv/g6-editor
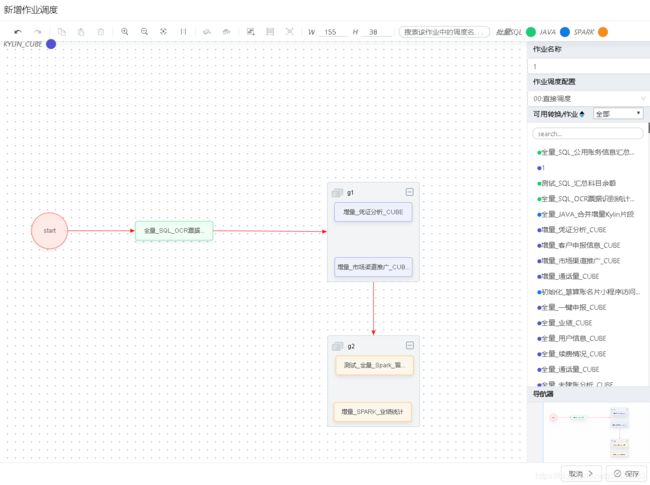
你好! 这是一篇讲解怎么使用g6-editor实现一个流程调度功能的文章。如果你想学习如何使用g6-editor, 可以仔细阅读这篇文章,了解一下g6-editor的基本用法知识。网上关于这方面的资料还算多,但是能比较详细讲解的是少之又少,顺手记录我在项目中的运用,希望对有这方面需求的同学有所帮助。

安装并在代码中引入
npm install @antv/g6-editor
import G6Editor from '@antv/g6-editor';
this.editor = new G6Editor();
添加组件
// 缩略图
const minimap = new G6Editor.Minimap({
  container: 'minimap'
});
// 工具栏
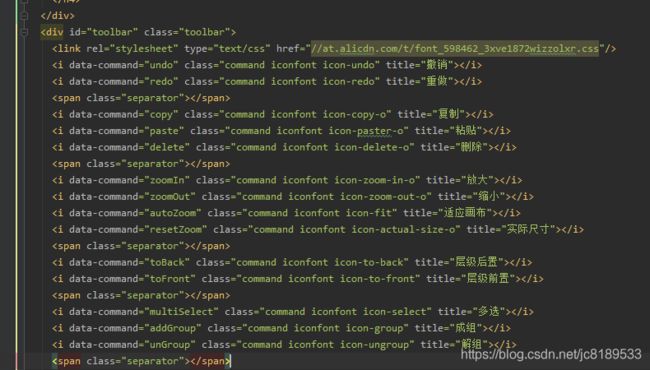
const toolbar = new G6Editor.Toolbar({
  container: 'toolbar'
});
// 菜单
const contextmenu = new G6Editor.Contextmenu({
  container: 'contextmenu'
});
// 画布
const itempannel = new G6Editor.Itempannel({
  container: 'itempannel'
});
// 详情信息
const detailpannel = new G6Editor.Detailpannel({
  container: 'detailpannel'
});
// 添加组件
this.editor.add(toolbar);
this.editor.add(minimap);
this.editor.add(contextmenu);
this.editor.add(itempannel);
this.editor.add(detailpannel);
container指向的是挂载组件的id。
获取当前页
// 获取最基础图类
const CPage = this.editor.getCurrentPage();
比如想获取图中的数据:node/group/edge,可用如下方式:
const nodes = CPage.getNodes() || [];
const edges = CPage.getEdges() || [];
const groups = CPage.getGroups() || [];
监听事件,如鼠标选择图形时:
CPage.on('afteritemselected', ev => {
      this.selectedItem = ev.item;
      const model = ev.item.getModel();
      if (model.text === undefined) {
        model.text = model.name;
      }
      this.selectedModel = model;
      /* 改变大小的对象为节点 */
      if (model.type === 'node') {
        const { size, root, configType } = model;
        this.selectedNodeWidth = size.split('*')[0];
        this.selectedNodeHeight = size.split('*')[1];
        this.selectedJobName = model.text;
        /* 是否显示作业调度配置 */
        this.showCron = root === '1';
        this.configType = configType ? configType : '00';
      }else if (model.type === 'group'){
        this.selectedGroupName = model.label;
        this.showCron = true;
      }
      this.jobList.nativeElement.style.height = this.detailPannel.nativeElement.clientHeight - 310 + 'px';
    });
Flow
流程图⻚⾯类,继承⾃ Page 专⽤于构建 的流程图编辑器。
this.flow = new G6Editor.Flow({
	graph: {
	  container: 'page',
	  // plugins: [ tooltip, textDisplay, layout ],
	  plugins: [tooltip], // 鼠标悬浮显示,是一个插件,需要外部手动引入
	  width: _self.editorWidth,
	  height: _self.editorHeight,
	  fitView: 'autoZoom',
	},
	shortcut: {
	  save: true,
	  zoomIn: true,   // 开启放大快捷键
	  zoomOut: true, // 开启视口缩小快捷键
	},
	noEndEdge: false, // 不允许悬空边,
	align: {
	  grid: true // 是否显示网格对齐线
	}
});
// 获取画板
const graph = this.flow.getGraph();
如果需要定义edge/node/group的配置,则需要用到这个graph,如下:
// 定义edge的配置
    graph.edge({
      // shape: "flow-polyline-round",
      // 去除相同连线
      color(model) {
        if (!model.color) {
          const edges = CPage.getEdges();
          for (const i in edges) {
            if (edges.hasOwnProperty(i)){
              const edgeModel = edges[i].getModel();
              if (edgeModel.source === model.source && edgeModel.target === model.target) {
                setTimeout(() => {
                  graph.remove(model.id);
                })
              }
            }
          }
        }
        return '#FF0000';
      },
      type: 'edge',
      // index: 3,
    });
每添加一条连线时就会执行这段代码,借助color属性,检验是否存在重复的线段,node和group的用法类似。
graph还有一个很重要的方法:update(id, model),id:需要更新对象的id,model:对象数据模型,用来更新视图数据。当从图中删除某些数据时,布局可能发生变化,会出现连线不紧密等问题,这时需要更新数据,重新连线:
/* 重新绘制图形,主要是重画线 */
  repaintGraph(): void {
    const graph = this.flow.getGraph();
    const edges = graph.getEdges();
    for (const i in edges) {
      if (edges.hasOwnProperty(i)){
        const model = edges[i].getModel();
        graph.update(model.id, model);
      }
    }
  }
从后端接口拿到数据后渲染
这里也是用到了上面的graph,主要是通过方法graph.add(type, data)来添加,type是一个字符串,可以是node、edge、group,data是将要添加的数据。
// 画图顺序: group -> node -> edge
const {group, node, edge} = JSON.parse(this.job.data);
        if (group.length) {
          group.forEach((g) => {
            /* 如果组有折叠的,需要先展开,不然无法画图 */
            g['collapsed'] = false;
            graph.add('group', g);
          })
        }
        if (node.length) {
          node.forEach((n) => {
            graph.add('node', n);
          })
        }
        // collapsed
        if (edge.length) {
          edge.forEach((e) => {
            graph.add('edge', e);
          })
        }
        /* 按照保存时组是否折叠,还原 */
        if (group.length) {
          const CPage = this.editor.getCurrentPage();
          group.forEach((g) => {
            if (!g.isCollapsed) return;
            CPage.update(g.id, {
              collapsed: g.isCollapsed
            });
          })
        }
这一步需要注意很重要的一点是画图的顺序: group -> node -> edge,如果不按照这个顺序,画图将失败。
toolbar
Command
利用Command.registerCommand自定义命令:
 /* 自定义命令 */
  setCustomCommand() {
    const _self = this;
    const Command = G6Editor.Command;
    Command.registerCommand('addEdge', {
      queue: true,  // 命令是否进入队列,默认是 true
      // 命令是否可用
      enable(/* editor */) {
        return true;
      },
      // 正向命令
      execute(editor) {
      // 在这里执行你想做的事
        _self.searchName = '';
        _self.showJobNameInput = true;
      },
      // 反向命令
      back(/* editor */) {
      }
    });
    // 查看sql详情
    Command.registerCommand('viewSQL', {
      queue: true,
      enable() {
        return true;
      },
      execute(editor) {
        _self.sqlsList = _self.getSqlDetail(_self.selectedModel);
        _self.createModal();
      },
      back() {

      }
    })
  }
执行命令后执行自定义代码,如执行删除操作后需要重绘:
this.editor.on('aftercommandexecute', ev => {
      /* 删除了数据,需要重新画线 */
      if (ev.command.name === 'delete') {
        if (_self.rootMode && ev.command.itemIds[0] === _self.rootMode.id)
          _self.rootMode = '';
        // 等待信息删除后重绘
        setTimeout(() => {
          this.repaintGraph();
        });
      }
      /* 展开组,需要重新画线 */
      if (ev.command.name === 'collapseExpand') {
        this.repaintGraph();
      }
    });
图形转数据
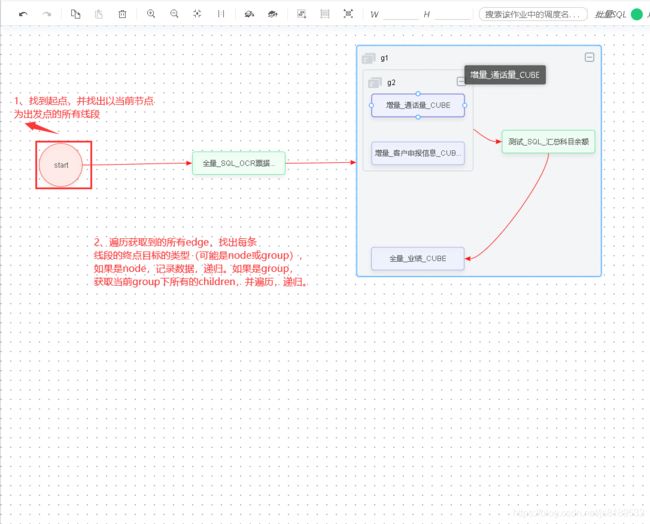
前面构建数据讲的差不多了,我们做这个最终的目的是将图形转换为数据。图中数据类型主要有三种:edge、node、group。核心思想是:从起点开始,找出以当前节点(node)为出发点的所有连线(edeg),遍历这些edge,如果连线的终点是node,则递归,如果是group,则找到属于这个group的所有children(node/group),然后递归,递归结束条件是以当前node为出发点的edge的数量为0:

end~
