matlab get(gcf,'postion ')相关解释
先看实例:
%% plot
figure;
kSet=[1:30]';
 plot(kSet,acc_pca,'-+',...
     kSet,acc_pcal1,'-s',...
     kSet,acc_2dpca,'-v',...
     kSet,acc_2dpcal1,'-*',...
     kSet,acc_2dpcal1s,'-o');
pos=get(gcf,'Position');
scale=1.2;
set(gcf,'Position',[pos(1),pos(2),pos(3)/scale,pos(4)/scale]);
legend('PCA','PCA-L1','2DPCA','2DPCA-L1','2DPCAL1S','location','Southeast');
xlabel('Number of extracted basis vectors');
ylabel('Classification accuracy');
saveas(gcf,sprintf('demo_classify_%s',face_name),'epsc2');
saveas(gcf,sprintf('demo_classify_%s',face_name));%默认的图片格式fig解读pos=get(gcf,'Position');
gcf:当前图窗的句柄
fig = gcf; % current figure handle
fig.Color = [0 0.5 0.5];
fig.ToolBar = 'none';
gca:当前坐标区或图
ax = gca; % current axes
ax.FontSize = 12;
ax.TickDir = 'out';
ax.TickLength = [0.02 0.02];
ax.YLim = [-2 2];
结果:
>> gcf

ans =

  Figure (1) (具有属性):

      Number: 1
        Name: ''
       Color: [0.9400 0.9400 0.9400]
    Position: [680 558 560 420]
       Units: 'pixels'
>> gca
ans =
Axes (具有属性):
XLim: [0 1]
YLim: [0 1]
XScale: 'linear'
YScale: 'linear'
GridLineStyle: '-'
Position: [0.1300 0.1100 0.7750 0.8150]
Units: 'normalized'gcf参数控制[pos(1) pos(2)]为绘图区域左下点的坐标 pos(3):长 pos(4):宽
gca的position很像,自己领悟
下面我们带来一些直观上的感受:
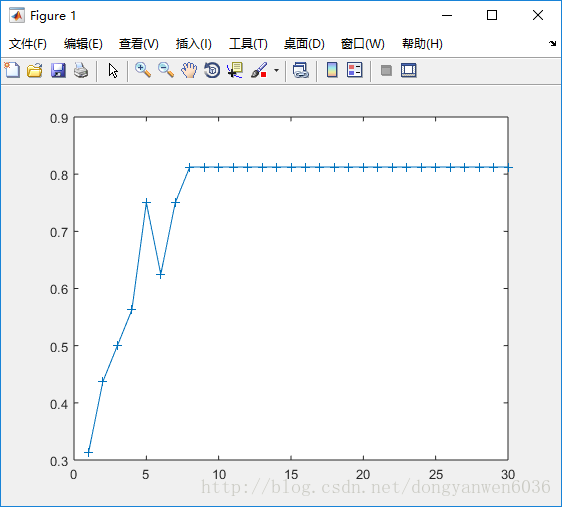
原来
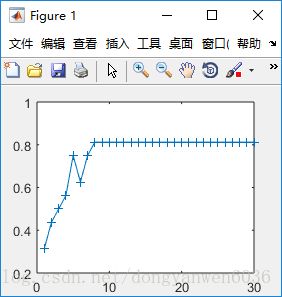
set(gcf,'Position',[pos(1),pos(2),pos(3)/2,pos(4)/2])设置后
原来:
set(gca,'Position',[pos(1),pos(2),pos(3)/2,pos(4)/2])


