机器学习算法04——多项式回归算法实战
摘要:本文主要介绍机器学习算法的多项式回内容。包括多项式回归的介绍,其与线性回归的区别,实战内容。
1.多项式回归的介绍
线性回归只适用于满足线性关系的数据,而对于非线性的拟合效果很差;多项式回归是在线性回归的基础上,进行改进,从而可以对非线性数据进行拟合。
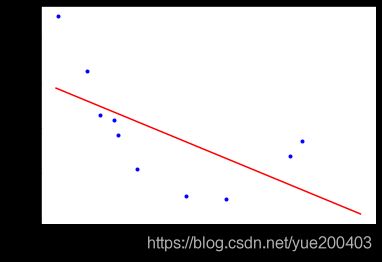
如图所示,下图为数据呈现出线性关系,用线性回归可以得到较好的拟合效果。

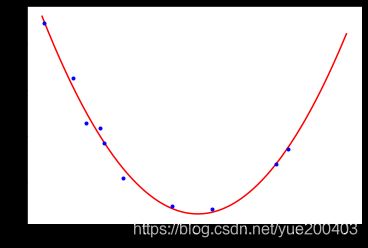
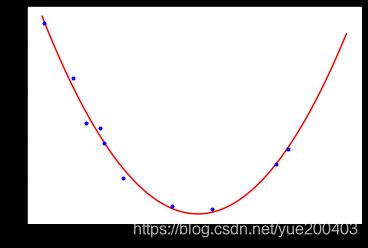
而下图图数据呈现非线性关系,则需要多项式回归模型。多项式回归是在线性回归基础上进行改进,相当于为样本再添加特征项。为样本添加一个x^2的特征项,可以较好地拟合非线性的数据。


如果将x2理解为一个特征,将x理解为另外一个特征。换句话说,本来我们的样本只有一个特征x,现在我们把他看成有两个特征的一个数据集。多了一个特征x2,那么从这个角度来看,这个式子依旧是一个线性回归的式子,但是从x的角度来看,他就是一个二次的方程。
2.多项式回归实践
1.导入要用到的库
import numpy as np
from scipy import stats
import matplotlib.pyplot as plt
from sklearn.preprocessing import PolynomialFeatures
from sklearn.linear_model import LinearRegression
from sklearn.metrics import mean_squared_error
2.生成数据
data = np.array([[ -2.95507616,  10.94533252],
       [ -0.44226119,   2.96705822],
       [ -2.13294087,   6.57336839],
       [  1.84990823,   5.44244467],
       [  0.35139795,   2.83533936],
       [ -1.77443098,   5.6800407 ],
       [ -1.8657203 ,   6.34470814],
       [  1.61526823,   4.77833358],
       [ -2.38043687,   8.51887713],
       [ -1.40513866,   4.18262786]])
m = data.shape[0]
X = data[:, 0].reshape(-1, 1)
y = data[:, 1].reshape(-1, 1)
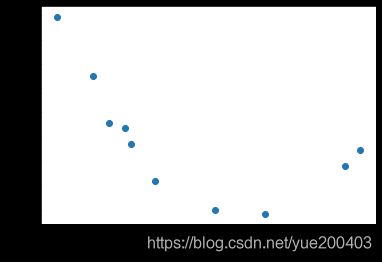
plt.scatter(X,y)
plt.xlabel('X')
plt.ylabel('y')
plt.show()
3.使用线性回归模型预测
lin_reg = LinearRegression()
lin_reg.fit(X, y)
print(lin_reg.intercept_, lin_reg.coef_)  # [ 4.97857827] [[-0.92810463]] intercept_存放截距 coef_存放回归系数
a = lin_reg.coef_[0][0]
b = lin_reg.intercept_[0]

X_plot = np.linspace(-3, 3, 1000).reshape(-1, 1)
y_plot = np.dot(X_plot, lin_reg.coef_.T) + lin_reg.intercept_
plt.plot(X_plot, y_plot, 'r-')
plt.plot(X, y, 'b.')
plt.xlabel('X')
plt.ylabel('y')
plt.savefig('regu-2.png', dpi=200)
print("方程:y = {}x+{}".format(a,b))
[4.97857827] [[-0.92810463]]
方程:y = -0.928104631330223x+4.978578268385674
5.计算误差
#计算误差
h = np.dot(X.reshape(-1, 1), lin_reg.coef_.T) + lin_reg.intercept_
print(mean_squared_error(h, y)) # 3.34
6.使用多项式回归模型预测
#使用多项式 先把X变成X2
poly_features = PolynomialFeatures(degree=2, include_bias=False)
X_poly = poly_features.fit_transform(X)
print(X_poly)
lin_reg = LinearRegression()
lin_reg.fit(X_poly, y)
print(lin_reg.intercept_, lin_reg.coef_)  # [ 2.60996757] [[-0.12759678  0.9144504 ]]
a = lin_reg.coef_[0][0]
b = lin_reg.coef_[0][1]
c = lin_reg.intercept_[0]

X_plot = np.linspace(-3, 3, 1000).reshape(-1, 1)
X_plot_poly = poly_features.fit_transform(X_plot)
y_plot = np.dot(X_plot_poly, lin_reg.coef_.T) + lin_reg.intercept_
plt.plot(X_plot, y_plot, 'r-')
plt.plot(X, y, 'b.')
plt.show()
print("方程:y = {}x^2+{}x+{}".format(a,b,c))
方程:y = -0.12759677531960217x^2+0.9144504037069671x+2.6099675666951736
通过观察代码,可以发现训练多项式方程与直线方程唯一的差别是输入的训练集X的差别。在训练直线方程时直接输入了X的值,在训练多项式方程的时候,还添加了我们计算出来的x2这个“新特征”的值(由于x2完全是由x的值确定的,因此严格意义上来讲此时该模型只有一个特征x)。
往期文章推荐:
机器学习算法03——线性回归算法实战
机器学习笔记02——线性回归实践
机器学习算法01—— K近邻算法学习笔记
本文参考文章:https://www.cnblogs.com/Belter/p/8530222.html


