等待事件 os thread startup
等待事件 os thread startup 官方文档和MOS上的信息比较少。
以下是网络上的整理和结合实际生产环境中的一些总结
“This wait event might be seen if the database server is executing on a platform that supports multi-threading. We enter this waiting state while a thread is starting up and leave the wait state when the thread has started or the startup request is cancelled.
This indicates some high contention at OS level avoiding even new process startup.
Issue is related to OS please involve system admin to solve same.”
‘os thread startup’ takes significant amount of time in ‘create index parallel’.
All slaves are allocated one by one in serial.
SQL tracing on foreground, there is one ‘os thread startup’ wait per slave, each wait takes 100ms. –> May
need investigation
When there are 512 slaves, ‘os thread startup’ wait take 50 seconds before the slaves start to do any job.
Resolution is to set *.parallel_min_servers=512 to pre-allocated 512 slaves per instance duirng instance
startup, or to run PCIX twice and ignore the first run
MOS上的一篇文档 :
Solaris: database instance hangs intermittently with wait event: 'os thread startup' (Doc ID 1909881.1)
'os thread startup' indicates some high contention at OS level avoiding even new process startup.
Oracle 官方论坛上的讨论,这个是job_queue_process触发的该等待事件
https://community.oracle.com/thread/3906895?parent=MOSC_EXTERNAL&sourceId=MOSC&id=3906895 从侧面验证了OS竞争 。
I that really a problem? Those are pretty tiny wait times...surely you have bigger fish to fry than this....
When JOB_QUEUE_PROCESSES=0, then no jobs are allowed to start. See the doc I linked for details on this parameter.
Since no jobs are allowed to start, no processes start. Remember that I said in the beginning of this thread:
The wait event 'os thread startup' occurs when a process needs to wait for another process to be started.
If no jobs can start, then no processes need to start and this wait will not be seen. As soon as you set this parameter to a non-zero value, jobs can start. When a job starts, it needs a process to run in. It must wait for that process to be spawned, hence this wait event. Note: I am only speaking about the CJQ0 process here. I'll tackle MMON later.
Now let's go back to that documentation I linked above. In it, it says:
JOB_QUEUE_PROCESSES specifies the maximum number of job slaves per instance that can be created for the execution ofDBMS_JOB jobs and Oracle Scheduler (DBMS_SCHEDULER) jobs.
This is a maximum number of processes, not a minimum. When a job needs to start, CJQ0 will get a process for it. CJQ0 waits for that process to start, hence the wait event. Once the process is started on the server, the job will use that process to run in. Once the job completes (successfully or not), the process is ended. The next job will need a new process. The job processes always terminate when the job ends so you will always see wait events for this with CJQ0.
So what about MMON? MMON is the Manageability Monitor Process. MMON takes AWR snapshots and performs ADDM analysis and more. MMON uses slave processs to do its work. The slave process are named Mnnn where nnn is a number. When MMON needs to start a slave process, it must wait for the process to start. At that time, you will see MMON wait for the 'os thread startup' wait event.
The big question is if this is an issue or not. Looking at those small blips on your graph, this is not an issue. If the wait events were significant in duration, then it can be a sign the OS is not able to respond to new process requests in a timely manner...that the OS is having resource contention. I did say in my first reply to this thread:
Check OS resource utilization during times when this wait event is high.
However, your graph does not show any periods when this wait event is "high". Far from it. I bet you really had to drill down just to see these. I'd be surprised if CPU usage and/or User I/O were not more dominant in your system.
Remember, just because a process had to wait for an event to complete does not mean a problem is at hand. We all have to wait for something at some point. It's only when that event completion is leading to a big bottleneck that it needs analysis.
Cheers,
Brian
-- 内存管理方式。另外,在生产环境中,多套功能类似的数据库,发现设置memory_target后,该等待事件出现过。没有设置memory_target后,没有出现该等待时间
SQL> show parameter memory

NAME				     TYPE	 VALUE
------------------------------------ ----------- ------------------------------
hi_shared_memory_address	     integer	 0
memory_max_target		     big integer 792M
memory_target			     big integer 792M
shared_memory_address		     integer	 0
SQL> show parameter sga

NAME				     TYPE	 VALUE
------------------------------------ ----------- ------------------------------
lock_sga			     boolean	 FALSE
pre_page_sga			     boolean	 FALSE
sga_max_size			     big integer 792M
sga_target			     big integer 0
SQL> show parameter pga

NAME				     TYPE	 VALUE
------------------------------------ ----------- ------------------------------
pga_aggregate_target		     big integer 0
SQL>
-- 查看该等待时间,属于concurrency类的 ,说明是配置类的等待事件 。
SQL> select name,wait_class from v$event_name where name ='os thread startup';

NAME
----------------------------------------------------------------
WAIT_CLASS
----------------------------------------------------------------
os thread startup
Concurrency


SQL>
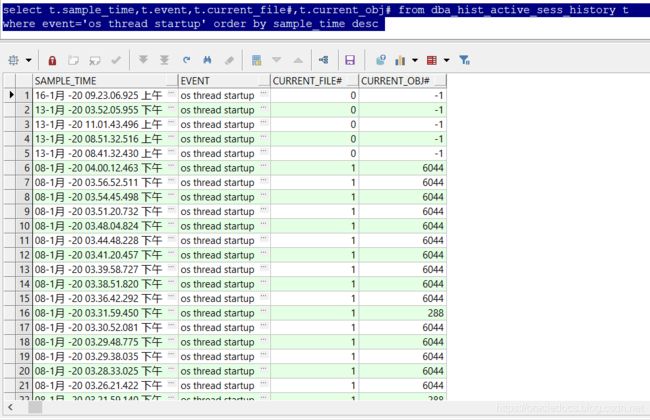
-- 查看历史会话中的os thread startup 等待事件,对应的file是1
select t.sample_time,t.event,t.current_file#,t.current_obj# from dba_hist_active_sess_history t
where event='os thread startup' order by sample_time desc
查看file1的文件大小,file1 是system01.dbf 。自动扩展,剩余空间不足。扩展空间后,该等待时间再也没有发生。
总结,目前官网和MOS上这个等待事件的信息比较少。
目前自己碰到过的和收集网上的信息,该等待时间与以下有关:
1 设置了memory_target .可能会因为内存自动管理方面的原因(比如内存的抖动问题,在抖动过程中,其他进程需要等待抖动完成),造成该等待事件的出现,(等待事件“os线程启动”发生在一个进程需要等待另一个进程启动的时候,The wait event 'os thread startup' occurs when a process needs to wait for another process to be started.)
2 并行问题引起
3 system 表空间不足,一边工作OS一边扩展表空间(符合一个进程需要等待另一个进程启动的情况)。
其他问题,可以留言讨论。
END
