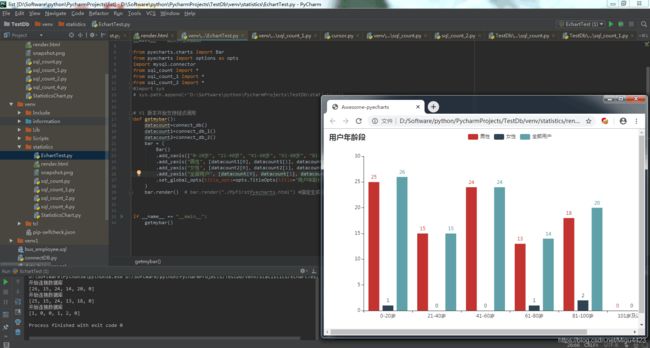
一个较为完整的pyecharts(取数画直方图)
思路:
1、通过连接数据库,查询sql脚本取到对应数据
2、对数据进行画图
前提:
1、已安装数据库mysql
2、python已安装mysql.connector包及pyecharts
3、表结构为:
CREATE TABLE `bus_user` (
  `EMP_ID` int(11) NOT NULL AUTO_INCREMENT COMMENT '用户ID',
  `STATUS` tinyint(2) NOT NULL COMMENT '用户状态 1-正常;2:-锁定;3-冻结;4-删除',
  `PINYIN` varchar(1) DEFAULT NULL COMMENT '用户姓名首字母',
  `CREATE_TIME` datetime NOT NULL COMMENT '创建时间',
  `UPDATE_TIME` datetime NOT NULL COMMENT '修改时间',
  `WEIGHT` tinyint(2) NOT NULL COMMENT '排序',
  `NICK_NAME` varchar(12) DEFAULT NULL COMMENT '昵称',
  `GENDER` tinyint(2) NOT NULL COMMENT '性别',
  `ID_CARD_NO` varchar(18) DEFAULT NULL COMMENT '身份证号码',
  `HEAD_IMG` varchar(100) DEFAULT NULL,
  `BIRTHDAY` date DEFAULT NULL COMMENT '出生年月',
  `AGE` int(11) DEFAULT NULL COMMENT '年龄',
  PRIMARY KEY (`EMP_ID`)
) ENGINE=InnoDB AUTO_INCREMENT=100 DEFAULT CHARSET=utf8 COMMENT='用户信息表';
第一步:取数(写一个函数,返回多个值)
sql_count_all.py
#-*- coding:utf-8 -*-
__author__ = 'grit'
__time__ = '2019-12-02'
__dict__ = '此文件用来获取用户年龄段的数量'
import mysql.connector


def connect_db_all():
    print('开始连接数据库')
    #打开数据库
    db = mysql.connector.connect(
        host='****',         # 数据库主机地址
        user='***',              # 数据库用户名
        passwd='*****',          # 数据库密码
        database='enterprise_db_test',   # 连接已有数据库,如果不存在则报错
        autocommit=True
     )

    sql_countall= []
    sql_count_one = []
    sql_count_second = []
    cursor = db.cursor()
    for i in range(0,6):
        if i < 5:
            sql_count = 'SELECT count(*) FROM `bus_user` where AGE > {0} and AGE <= {1}' .format(0+20*i,20+20*i)
            cursor.execute(sql_count)
            data_sql = cursor.fetchall()
            sql_countall.append(int(data_sql[0][0]))
            sql_count_1 = 'SELECT count(*) FROM `bus_user` where AGE > {0} and AGE <= {1} and GENDER ={2}'. \
                format(0 + 20 * i, 20 + 20 * i, 1)
            cursor.execute(sql_count_1)
            data_sql_1 = cursor.fetchall()
            sql_count_one.append(int(data_sql_1[0][0]))
            sql_count_2 = 'SELECT count(*) FROM `bus_user` where AGE > {0} and AGE <= {1} and GENDER ={2}'. \
                format(0 + 20 * i, 20 + 20 * i, 2)
            cursor.execute(sql_count_2)
            data_sql_2 = cursor.fetchall()
            sql_count_second.append(int(data_sql_2[0][0]))
        else:
            sql_count = 'SELECT count(*) FROM `bus_user` where AGE > {0}'.format(100)
            cursor.execute(sql_count)
            data_sql = cursor.fetchall()
            sql_countall.append(int(data_sql[0][0]))
            sql_count_1 = 'SELECT count(*) FROM `bus_user` where AGE > {0} and GENDER ={1}'.format(100, 1)
            cursor.execute(sql_count_1)
            data_sql_1 = cursor.fetchall()
            sql_count_one.append(int(data_sql_1[0][0]))
            sql_count_2 = 'SELECT count(*) FROM `bus_user` where AGE > {0} and GENDER ={1}'.format(100, 1)
            cursor.execute(sql_count_2)
            data_sql_2 = cursor.fetchall()
            sql_count_second.append(int(data_sql_2[0][0]))
        #print(int(data_sql[0][0]))
    print(sql_countall)
    print(sql_count_one)
    print(sql_count_second)
    cursor.close()
    db.close()
    return sql_countall,sql_count_one,sql_count_second

#
# if __name__ == "__main__":
#     (sql_countall,sql_count_one,sql_count_second)=connect_db_all()
#     for countall in  sql_countall:
#         print(countall)
#     for countone in  sql_count_one:
#         print(countone)
#     for countsecond in  sql_count_second:
#         print(countsecond)
第二步:调用函数,获取数据,对数据进行画图
#-*- coding:utf-8 -*-
__author__ = 'grit'
__time__ = '2019-12-04'
__dict__ = '此文件生成图表'

from pyecharts.charts import Bar
from pyecharts import options as opts
import mysql.connector
# from sql_count import *
# from sql_count_1 import *
# from sql_count_2 import *
from sql_count_all import *
#import sys
# sys.path.append(r'D:\Software\python\PycharmProjects\TestDb\statistics')


# # V1 版本开始支持链式调用
# def getmybar():
#     datacount=connect_db()
#     datacount1=connect_db_1()
#     datacount2=connect_db_2()
#     bar = (
#         Bar()
#         .add_xaxis(["0-20岁", "21-40岁", "41-60岁", "61-80岁", "81-100岁", "101岁及以上"])
#         .add_yaxis("男性", [datacount1[0], datacount1[1], datacount1[2], datacount1[3], datacount1[4], datacount1[5]])
#         .add_yaxis("女性", [datacount2[0], datacount2[1], datacount2[2], datacount2[3], datacount2[4], datacount2[5]])
#         .add_yaxis("全部用户", [datacount[0], datacount[1], datacount[2],datacount[3],datacount[4],datacount[5]])
#         .set_global_opts(title_opts=opts.TitleOpts(title="用户年龄段"))
#     )
#     bar.render()  # bar.render("./MyFirstPyecharts.html") #指定生成html的路径,不指定会默认生成在当前路径下,命名为render.html


def getmybar_1():
    (datacount, datacount1, datacount2) = connect_db_all()
    bar = (
        Bar()
        .add_xaxis(["0-20岁", "21-40岁", "41-60岁", "61-80岁", "81-100岁", "101岁及以上"])
        .add_yaxis("男性", [datacount1[0], datacount1[1], datacount1[2], datacount1[3], datacount1[4], datacount1[5]])
        .add_yaxis("女性", [datacount2[0], datacount2[1], datacount2[2], datacount2[3], datacount2[4], datacount2[5]])
        .add_yaxis("全部用户", [datacount[0], datacount[1], datacount[2],datacount[3],datacount[4],datacount[5]])
        .set_global_opts(title_opts=opts.TitleOpts(title="用户年龄段"))
    )
    bar.render()  # bar.render("./MyFirstPyecharts.html") #指定生成html的路径,不指定会默认生成在当前路径下,命名为render.html


if __name__ == "__main__":
    getmybar_1()
写在后面的话:
其实在获取数据库值时,可以通过存储过程或者executemany方式来优化,后续补充。
