R 语言 optim 使用
stats中的optim函数是解决优化问题的一个简易的方法。
Univariate Optimization
f = function(x,a) (x-a)^2
xmin = optimize(f,interval = c(0,1),a=1/3)
xmin
General Optimization
optim函数包含了几种不同的算法。
算法的选择依赖于求解导数的难易程度,通常最好提供原函数的导数。
在求解之前,一般需要scale。
可以尝试用不同的方法求解同样的问题。
Nelder-Mead method
optim默认的方法。
又称下山单纯形法,可做非线性函数的极值以及曲线拟合。
其主要思想是:
在n维空间构建(n+1)顶点的多面体,通过reflection, expansion, contraction ,来逐步逼近最佳点。
特点是:
1. 不适用函数的导数信息
2. 对不可导函数适用
3. 可能很慢
BFGS method属于quasi-Newton方法。首先,简单介绍牛顿法: 牛顿法基于目标函数的二阶导数(海森矩阵),收敛速度快,迭代次数少,尤其在最优值附近,收敛速度是二次的。
缺点是:海森矩阵稠密时,每次迭代计算量较大,且每次都会重新计算目标函数的海森矩阵的逆。这样以来,问题规模大时,其计算量以及存储空间都很大。
拟牛顿法是在牛顿法基础上的改进,其引入了海森矩阵的近似矩阵,避免了每次迭代都需要计算海森矩阵的逆,其收敛速度介于梯度下降和牛顿法之间,属于超线性。
同时,牛顿法在每次迭代时不能保证海森矩阵总是正定的,一旦其不是正定,优化方向就会跑偏,从而使牛顿法失效,也证明了牛顿法的稳健性较差。
拟牛顿法利用海森矩阵的逆矩阵?代替海森矩阵,虽然每次迭代不一定保证最优化的方向,但是近似矩阵始终正定,因此算法总是朝着最优值搜索。
注意: 1. 使用函数导数信息,通过人工提供或者有限微分 2. 高维的数据存储会很大
CG method


 一种共轭梯度法(conjugate gradient),选择连续的、与椭圆轴线相仿的路径。


 特点:
 1. 不存储海森矩阵
 2. 三种不同的路径搜索方法
 3. 与BFGS相比,较差的稳定性
4. 使用函数导数信息
L-BFGS-B method
A limited memory version of BFGS
特点:
1. 不存储海森矩阵,只有一个对海森矩阵大小受限的更新步骤。
2. 使用导数信息
3. 可以把解决方法限制到box里,是optim中仅有的方法。
SANN method


 模拟退火法(simulated annealing)的变种。
特点:
1. 随机算法
2. 接受以正概率提升目标的改变
3. 不使用导数信息
4. 收敛很慢,但是找到一个good solution很快Brent method
An interface to optimize
特点:
1. 仅适用于一维问题
2. 可以在其他函数中包含How to use
Exampels
One Dimensional Ex1
optim假定
其导数为
# we supply negative f, since we want to maximize.
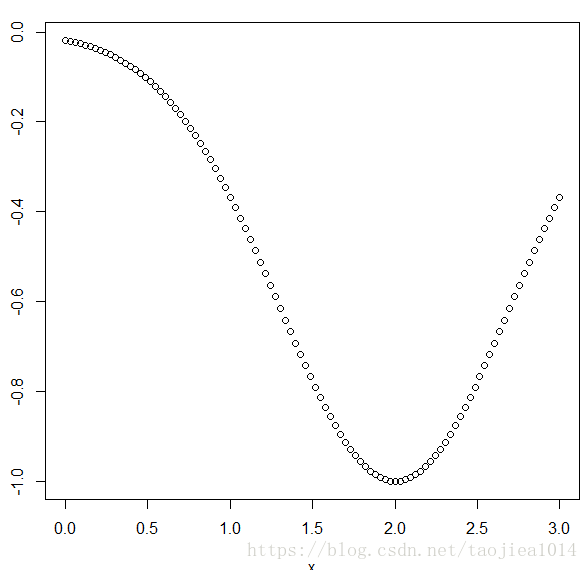
f <- function(x) -exp(-( (x-2)^2 ))
######### without derivative
# I am using 1 at the initial value
# $par extracts only the argmax and nothing else
optim(1, f)$par
######### with derivative
df <- function(x) -2*(x-2)*f(x)
optim(1, f, df, method="CG")$par
######### with "Brent" method
optim(1,f,method="Brent",lower=-0,upper=3)$par
# figure
x = seq(0,3,length.out = 100)
y = f(x)
plot(x,y)
One Dimensional Ex2
#算法可以很快地发现与初值相近的局部最优值。
f <- function(x) sin(x*cos(x))
optim(2, f)$par
optim(4, f)$par
optim(6, f)$par
optim(8, f)$par
Two Dimensional Ex3
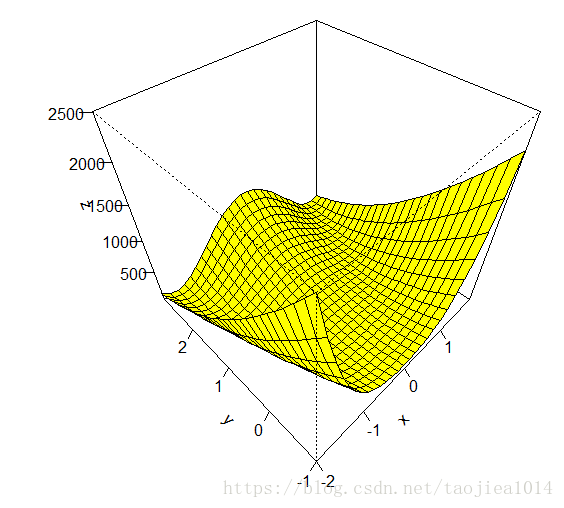
Rosenbrock function: This function is strictly positive, but is 0 when y = x^2, and x = 1, so (1, 1) is a minimum.
Let’s see if optim can figure this out. When using optim for multidimensional optimization, the input in your function definition must be a single vector.
# 绘图
f <- function(x1,y1) (1-x1)^2 + 100*(y1 - x1^2)^2
x <- seq(-2,2,by=.15)
y <- seq(-1,3,by=.15)
z <- outer(x,y,f)
persp(x,y,z,phi=45,theta=-45,col="yellow",shade=.00000001,ticktype="detailed")
# 求解
f <- function(x) (1-x[1])^2 + 100*(x[2]-x[1]^2)^2
# starting values must be a vector now
optim( c(0,0), f )$par
[1] 0.9999564 0.9999085
Two Dimensional Ex4
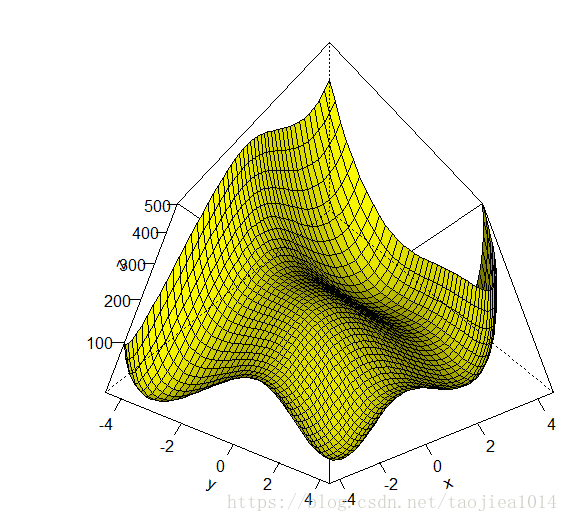
Himmelblau’s function:
There appear to be four “bumps” that look like minimums in the realm of (-4,-4), (2,-2),(2,2) and (-4,4).
Again this function is strictly positive so the function is minimized when x^2 + y − 11 = 0 and x + y^2 − 7 = 0.
#画图
f <- function(x1,y1) (x1^2 + y1 - 11)^2 + (x1 + y1^2 - 7)^2
x <- seq(-4.5,4.5,by=.2)
y <- seq(-4.5,4.5,by=.2)
z <- outer(x,y,f)
persp(x,y,z,phi=-45,theta=45,col="yellow",shade=.65 ,ticktype="detailed")
#求解局部最优值
f <- function(x) (x[1]^2 + x[2] - 11)^2 + (x[1] + x[2]^2 - 7)^2
optim(c(-4,-4),f)$par
 optim(c(2,-2), f)$par
 optim(c(2,2), f)$par
optim(c(-4,4),f)$par
#which are indeed the true minimums. This can be checked by seeing that #these inputs correspond to function values that are about 0.
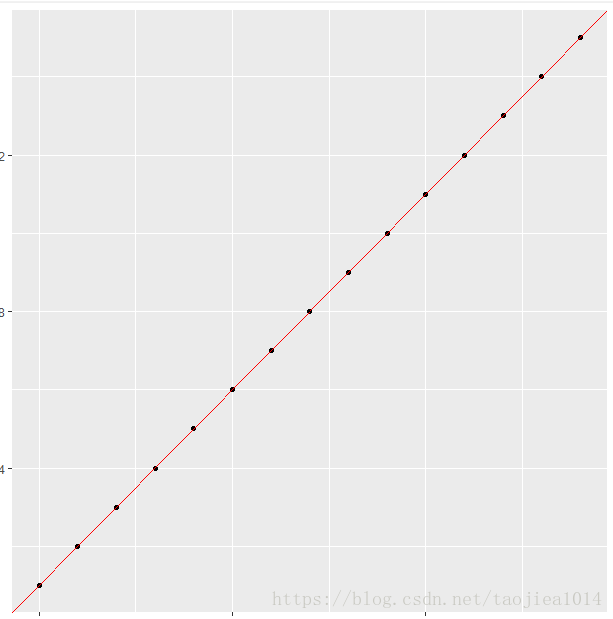
Minimise residual sum of squares
# 初始化数据
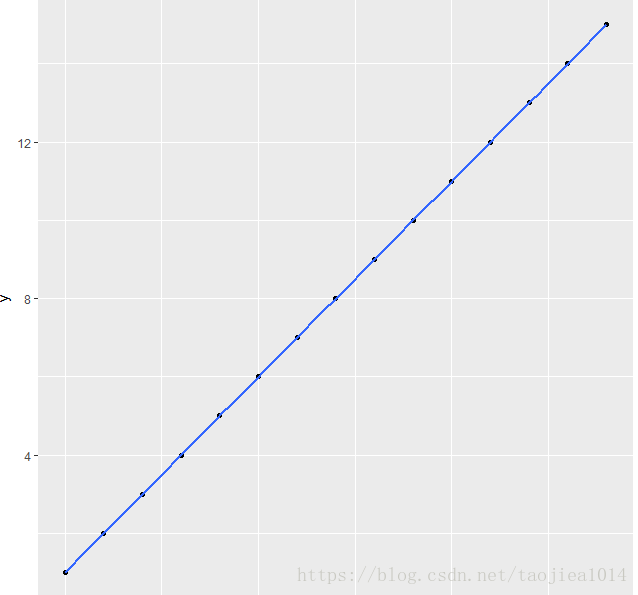
d = data_frame(x=1:6,y=c(1,3,5,6,8,12))
d
ggplot(d,aes(x,y)) + geom_point() + stat_smooth(method = "lm")
# 最小问题的优化函数
min.RSS = function(data,par) {
     with(data,sum((par[1]+par[2]*x-y)^2))
}
#optim函数调用的格式
result = optim(par=c(0,0),min.RSS,data=d)
#optim调用的结果参数
result$par
 result$value
 result$counts
 result$convergence
 result$message
#可视化分析结果
ggplot(d,aes(x,y)) + geom_point() +geom_abline(intercept=result$par[1],
slope=result$par[2],color="red")
#optim与lm的结果对比分析
lm(y~x,data=d)
result$par
Maximum likelihood
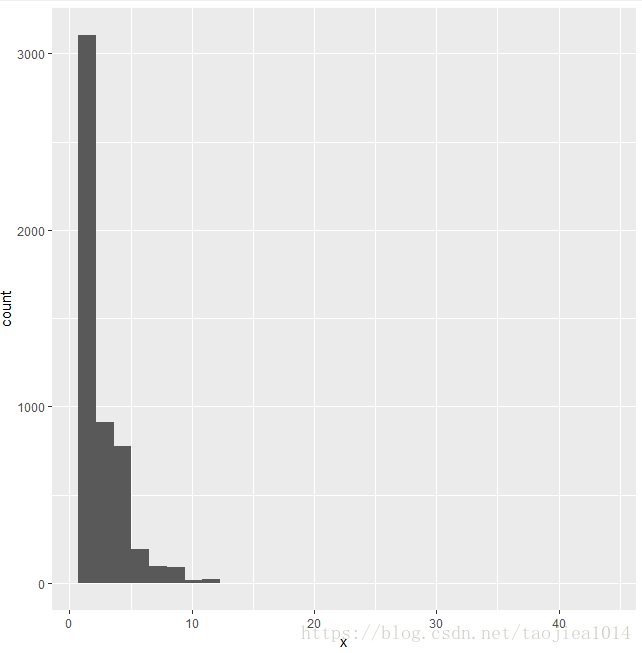
To fit a Poisson distribution to x I don’t minimise the residual sum of squares, instead I maximise the likelihood for the chosen parameter lambda.
# 观测数据
obs = c(1, 2, 3, 4, 5, 6, 7, 8, 9, 10, 11, 12, 13, 17, 42, 43)
freq = c(1392, 1711, 914, 468, 306, 192, 96, 56, 35, 17, 15, 6, 2, 2, 1, 1)
x <- rep(obs, freq)
plot(table(x), main="Count data")
qplot(x,stat_bin=1)
# 优化函数,注意“-”号
lklh.poisson <- function(x, lambda) lambda^x/factorial(x) * exp(-lambda)
log.lklh.poisson <- function(x, lambda){
-sum(x * log(lambda) - log(factorial(x)) - lambda)
}
# 调用optim
optim(par=2,log.lklh.poisson,x=x)
optim(par=2,log.lklh.poisson,x=x,method="Brent",lower=2,upper=3)
# 比较结果
library(MASS)
fitdistr(x, "Poisson")
mean(x)
# 系统信息
sessionInfo()
总结:这个函数需要知道所求最小值函数的表达式、
f = function(x,a) (x-a)^2
xmin = optimize(f,interval = c(0,1),a=1/3)
xmin


f <- function(x) -exp(-( (x-2)^2 ))

######### without derivative

# I am using 1 at the initial value

# $par extracts only the argmax and nothing else

optim(1, f)$par

######### with derivative

df <- function(x) -2*(x-2)*f(x)

optim(1, f, df, method="CG")$par

######### with "Brent" method

optim(1,f,method="Brent",lower=-0,upper=3)$par

# figure

x = seq(0,3,length.out = 100)

y = f(x)

plot(x,y)
$minimum
[1] 0.3333333
$objective
[1] 0
[1] 1.9
Warning message:
In optim(1, f) : 用Nelder-Mead方法来算一维优化不很可靠:
用"Brent"或直接用optimize()
>
[1] 2
[1] 2
f <- function(x) sin(x*cos(x))

optim(2, f)$par

optim(4, f)$par

optim(6, f)$par

optim(8, f)$par
[1] 2.316016
> optim(4, f)$par
[1] 4.342236
Warning message:
> optim(6, f)$par
[1] 5.688647
Warning message:
In optim(6, f) : 用Nelder-Mead方法来算一维优化不很可靠:
用"Brent"或直接用optimize()
> optim(8, f)$par
[1] 7.132227
Warning message:
In optim(8, f) : 用Nelder-Mead方法来算一维优化不很可靠:
# 绘图

f <- function(x1,y1) (1-x1)^2 + 100*(y1 - x1^2)^2

x <- seq(-2,2,by=.15)

y <- seq(-1,3,by=.15)

z <- outer(x,y,f)

persp(x,y,z,phi=45,theta=-45,col="yellow",shade=.00000001,ticktype="detailed")
# 求解

f <- function(x) (1-x[1])^2 + 100*(x[2]-x[1]^2)^2

# starting values must be a vector now

optim( c(0,0), f )$par
> optim( c(0,0), f )$par
[1] 0.9999564 0.9999085
>
#画图

f <- function(x1,y1) (x1^2 + y1 - 11)^2 + (x1 + y1^2 - 7)^2

x <- seq(-4.5,4.5,by=.2)

y <- seq(-4.5,4.5,by=.2)

z <- outer(x,y,f)

persp(x,y,z,phi=-45,theta=45,col="yellow",shade=.65 ,ticktype="detailed")

#求解局部最优值

f <- function(x) (x[1]^2 + x[2] - 11)^2 + (x[1] + x[2]^2 - 7)^2

optim(c(-4,-4),f)$par
optim(c(2,-2), f)$par
optim(c(2,2), f)$par

optim(c(-4,4),f)$par
> optim(c(-4,-4),f)$par
[1] -3.779347 -3.283172
> optim(c(2,-2), f)$par
[1] 3.584370 -1.848105
> optim(c(2,2), f)$par
[1] 3.000014 2.000032
> optim(c(-4,4),f)$par
[1] -2.805129 3.131435
> optim(c(-4,4),f)$par
[1] -2.805129 3.131435
>
Minimise residual sum of squares

# 初始化数据

d = data_frame(x=1:6,y=c(1,3,5,6,8,12))

d

ggplot(d,aes(x,y)) + geom_point() +  stat_smooth(method = "lm")

# 最小问题的优化函数

min.RSS = function(data,par) {
    with(data,sum((par[1]+par[2]*x-y)^2))

}

#optim函数调用的格式

result = optim(par=c(0,0),min.RSS,data=d)

#optim调用的结果参数

result$par

      result$value
      result$counts
      result$convergence
      result$message


#可视化分析结果


ggplot(d,aes(x,y)) + geom_point() +geom_abline(intercept=result$par[1],


    slope=result$par[2],color="red")

#optim与lm的结果对比分析

lm(y~x,data=d)


result$par
> d
x y z
1 0 1 a
2 1 2 b
3 2 3 c
4 3 4 a
5 4 5 b
6 5 6 c
7 6 7 a
8 7 8 b
9 8 9 c
10 9 10 a
11 10 11 b
12 11 12 c
13 12 13 a
14 13 14 b
15 14 15 c
> result$par
[1] 0.9998865 0.9999687
>
result$value
[1] 1.934804e-06
> result$counts
function gradient
79 NA
> result$convergence
[1] 0
> result$message
NULL
# 观测数据

obs = c(1, 2, 3, 4, 5, 6, 7, 8, 9, 10, 11, 12, 13, 17, 42, 43)

freq = c(1392, 1711, 914, 468, 306, 192, 96, 56, 35, 17, 15, 6, 2, 2, 1, 1)

x <- rep(obs, freq)

plot(table(x), main="Count data")

qplot(x,stat_bin=1)


# 优化函数,注意“-”号


lklh.poisson <- function(x, lambda) lambda^x/factorial(x) * exp(-lambda)

log.lklh.poisson <- function(x, lambda){

    -sum(x * log(lambda) - log(factorial(x)) - lambda)

}


# 调用optim

optim(par=2,log.lklh.poisson,x=x)

optim(par=2,log.lklh.poisson,x=x,method="Brent",lower=2,upper=3)

# 比较结果

library(MASS)

fitdistr(x, "Poisson")

mean(x)

# 系统信息

sessionInfo()


总结:这个函数需要知道所求最小值函数的表达式、
> optim(par=2,log.lklh.poisson,x=x)
$par
[1] 2.703516
$value
[1] 9966.067
$counts
function gradient
24 NA
$convergence
[1] 0
$message
NULL
Warning message:
In optim(par = 2, log.lklh.poisson, x = x) :
用Nelder-Mead方法来算一维优化不很可靠:
用"Brent"或直接用optimize()
> optim(par=2,log.lklh.poisson,x=x,method="Brent",lower=2,upper=3)
$par
[1] 2.703682
$value
[1] 9966.067
$counts
function gradient
NA NA
$convergence
[1] 0
$message
NULL
> # 比较结果
> library(MASS)
> fitdistr(x, "Poisson")
lambda
2.70368239
(0.02277154)
>
> mean(x)
[1] 2.703682
> sessionInfo()
R version 3.4.1 (2017-06-30)
Platform: x86_64-w64-mingw32/x64 (64-bit)
Running under: Windows >= 8 x64 (build 9200)
Matrix products: default
locale:
[1] LC_COLLATE=Chinese (Simplified)_China.936 LC_CTYPE=Chinese (Simplified)_China.936
[3] LC_MONETARY=Chinese (Simplified)_China.936 LC_NUMERIC=C
[5] LC_TIME=Chinese (Simplified)_China.936
attached base packages:
[1] stats graphics grDevices utils datasets methods base
other attached packages:
[1] MASS_7.3-47 ggplot2_2.2.1
loaded via a namespace (and not attached):
[1] Rcpp_0.12.13 lattice_0.20-35 rCharts_0.4.5 grid_3.4.1 plyr_1.8.4 gtable_0.2.0 scales_0.5.0
[8] rlang_0.1.4 lazyeval_0.2.1 whisker_0.3-2 labeling_0.3 RJSONIO_1.3-0 tools_3.4.1 munsell_0.4.3
[15] yaml_2.1.16 compiler_3.4.1 colorspace_1.3-2 tibble_1.3.4
