Kaggle入门(一)——Digit Recognizer
文章目录
- 0 前言
- 1 简介
- 2 数据准备
- 2.1 导入数据
- 2.2 检查空值
- 2.3 正则化 Normalization
- 2.4 更改数据维度 Reshape
- 2.5 标签编码
- 2.6 分割交叉验证集
- 3 CNN
- 3.1 定义网络模型
- 3.2 设置优化器和退火器 optimizer and annealer
- 3.3 数据增强
- 4 评估模型
- 4.1 训练和交叉验证曲线
- 4.2 混淆矩阵 Confusion matrix
- 5 生成结果
0 前言
比赛网址:https://www.kaggle.com/c/digit-recognizer
参考解法:https://www.kaggle.com/yassineghouzam/introduction-to-cnn-keras-0-997-top-6
需要用到的库:pandas、numpy、matplotlib、seaborn、sklearn、keras
1 简介
- 卷机网络模型
- 基于Keras
- 准确率99.6%
- 1080Ti,30个epoch,训练时间3min
导包:
import pandas as pd
import numpy as np
import matplotlib.pyplot as plt
import matplotlib.image as mpimg
import seaborn as sns
# %matplotlib inline

np.random.seed(2)

from sklearn.model_selection import train_test_split
from sklearn.metrics import confusion_matrix
import itertools

from keras.utils.np_utils import to_categorical # convert to one-hot-encoding
from keras.models import Sequential
from keras.layers import Dense, Dropout, Flatten, Conv2D, MaxPool2D
from keras.optimizers import RMSprop
from keras.preprocessing.image import ImageDataGenerator
from keras.callbacks import ReduceLROnPlateau

sns.set(style='white', context='notebook', palette='deep')
2 数据准备
2.1 导入数据
# Load the data
train = pd.read_csv("../input/train.csv")
test = pd.read_csv("../input/test.csv")

Y_train = train["label"]
X_train = train.drop(labels = ["label"],axis = 1)

# free some space
del train

g = sns.countplot(Y_train)
Y_train.value_counts()
1    4684
7    4401
3    4351
9    4188
2    4177
6    4137
0    4132
4    4072
8    4063
5    3795
Name: label, dtype: int64
2.2 检查空值
X_train.isnull().any().describe()
test.isnull().any().describe()
X_train
count       784
unique        1
top       False
freq        784
dtype: object
--------------------
test
count       784
unique        1
top       False
freq        784
dtype: object
X_train.isnull()会将整个数据表中所有项转换为bool型,空值为TrueX_train.isnull().any()会将所有列进行统计,列中包含空值,该列为True。可指定参数axis=1,对行进行统计X_train.isnull().any().describe()将信息进行汇总。count为总统计数;unique为种类(由于该数据中没有空值,全为False,故只有1类);top为最多的种类;freq为最多种类出现频次
2.3 正则化 Normalization
将数据正则化到[0, 1]范围内,减小光照的影响,并可加速CNN收敛速度
X_train = X_train / 255.0
test = test / 255.0
2.4 更改数据维度 Reshape
X_train = X_train.values.reshape(-1,28,28,1)
test = test.values.reshape(-1,28,28,1)
- 784个像素,28x28=784
- 最后需要多加一维,代表通道数(在Keras中需要)。
2.5 标签编码
将标签转化为one-hot类型
# eg.  2 -> [0,0,1,0,0,0,0,0,0,0])
Y_train = to_categorical(Y_train, num_classes = 10)
2.6 分割交叉验证集
random_seed = 2  #可去掉
X_train, X_val, Y_train, Y_val = train_test_split(X_train, Y_train, test_size = 0.1, random_state=random_seed)
train_test_split()函数说明:
Signature: train_test_split(*arrays, **options)
Docstring:
Split arrays or matrices into random train and test subsets

Parameters
----------
*arrays : sequence of indexables with same length / shape[0]
 Allowed inputs are lists, numpy arrays, scipy-sparse
 matrices or pandas dataframes.

test_size : float, int or None, optional (default=0.25). 分出来测试集的百分比

train_size : float, int, or None, (default=None). 训练集百分比,和上面那个写一个就行,另外一个会自动算

random_state : int, RandomState instance or None, optional (default=None)
 If int, random_state is the seed used by the random number generator;
 If RandomState instance, random_state is the random number generator;
 If None, the random number generator is the RandomState instance used
 by `np.random`.

shuffle : boolean, optional (default=True)
 Whether or not to shuffle the data before splitting. If shuffle=False
 then stratify must be None.

stratify : array-like or None (default=None)
 If not None, data is split in a stratified fashion, using this as
 the class labels. 一些不平衡的数据集需要添加这个参数
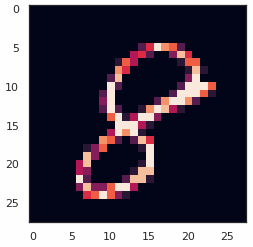
# Some examples
g = plt.imshow(X_train[0][:,:,0])
3 CNN
3.1 定义网络模型
网络结构:
- First Layer
- Conv2D 5x5x32
- Conv2D 5x5x32
- maxpool, size 2,2
- Second Layer
- Conv2D 3x3x64
- Conv2D 3x3x64
- maxpool, size 2,2 strides 2,2
- Third Layer
- Flatten
- Forth Layer
- full connect 256
- Fifth Layer
- full connect 10
model = Sequential()

model.add(Conv2D(filters = 32, kernel_size = (5,5),padding = 'Same',
                 activation ='relu', input_shape = (28,28,1)))
model.add(Conv2D(filters = 32, kernel_size = (5,5),padding = 'Same',
                 activation ='relu'))
model.add(MaxPool2D(pool_size=(2,2)))
#dropout用于正则化项,随机丢失一些节点,防止网络过拟合
model.add(Dropout(0.25))


model.add(Conv2D(filters = 64, kernel_size = (3,3),padding = 'Same',
                 activation ='relu'))
model.add(Conv2D(filters = 64, kernel_size = (3,3),padding = 'Same',
                 activation ='relu'))
model.add(MaxPool2D(pool_size=(2,2), strides=(2,2)))
model.add(Dropout(0.25))

# 将特征图转换成1D向量
model.add(Flatten())
model.add(Dense(256, activation = "relu"))
model.add(Dropout(0.5))
model.add(Dense(10, activation = "softmax"))
3.2 设置优化器和退火器 optimizer and annealer
定义好网络后,需设置得分函数、损失函数和优化算法。
- 优化器
- 这里选用RMS,还可以用Adam等
- 深度学习优化入门:Momentum、RMSProp 和 Adam
optimizer = RMSprop(lr=0.001, rho=0.9, epsilon=1e-08, decay=0.0)
- 编译模型
- 参数
metrics=["accuracy"]用于评估模型的表现
- 参数
model.compile(optimizer = optimizer , loss = "categorical_crossentropy", metrics=["accuracy"])
- 对学习率(LR)使用退火算法(annealing method)?
- 为了更快的接近全局最小值,Loss大时LR大,之后逐步减小LR
- 当准确率X步后不再提高,LR减半
learning_rate_reduction = ReduceLROnPlateau(monitor='val_acc',
                                            patience=3,
                                            verbose=1,
                                            factor=0.5,
                                            min_lr=0.00001)
- epochs和batch_size
- 过完一次完整的数据集是一个epoch
- 当数据集过大时,将数据集分成多个batch,依次训练
epochs = 1 # Turn epochs to 30 to get 0.9967 accuracy
batch_size = 86
3.3 数据增强
为了防止过拟合问题,使用一些方法扩大我们的数据集。
最理想的是使用一些小的变化改变训练数据。如:旋转、翻转、随机剪裁、缩放等
使用效果:
- 数据增强前,准确率98.1%
- 数据增强后,准确率99.6%
# 使用数据增强算法
datagen = ImageDataGenerator(
        featurewise_center=False,  # set input mean to 0 over the dataset
        samplewise_center=False,  # set each sample mean to 0
        featurewise_std_normalization=False,  # divide inputs by std of the dataset
        samplewise_std_normalization=False,  # divide each input by its std
        zca_whitening=False,  # apply ZCA whitening
        rotation_range=10,  # randomly rotate images in the range (degrees, 0 to 180)
        zoom_range = 0.1, # Randomly zoom image
        width_shift_range=0.1,  # randomly shift images horizontally (fraction of total width)
        height_shift_range=0.1,  # randomly shift images vertically (fraction of total height)
        horizontal_flip=False,  # randomly flip images
        vertical_flip=False)  # randomly flip images

datagen.fit(X_train)

history = model.fit_generator(datagen.flow(X_train,Y_train, batch_size=batch_size),
                              epochs = epochs, validation_data = (X_val,Y_val),
                              verbose = 2, steps_per_epoch=X_train.shape[0] // batch_size
                              , callbacks=[learning_rate_reduction])
# 不使用数据增强
history = model.fit(X_train, Y_train, batch_size = batch_size, epochs = epochs,
          validation_data = (X_val, Y_val), verbose = 2)
4 评估模型
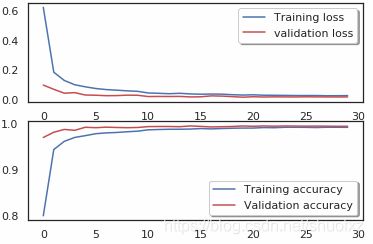
4.1 训练和交叉验证曲线
fig, ax = plt.subplots(2,1)
ax[0].plot(history.history['loss'], color='b', label="Training loss")
ax[0].plot(history.history['val_loss'], color='r', label="validation loss",axes =ax[0])
legend = ax[0].legend(loc='best', shadow=True)

ax[1].plot(history.history['acc'], color='b', label="Training accuracy")
ax[1].plot(history.history['val_acc'], color='r',label="Validation accuracy")
legend = ax[1].legend(loc='best', shadow=True)
- 2个epoch后,accuracy接近99%
- 交叉验证集准确率基本一直高于训练集准确率,表明模型没有过拟合
4.2 混淆矩阵 Confusion matrix
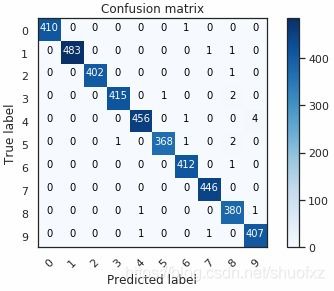
混淆矩阵用于了解模型的缺陷
def plot_confusion_matrix(cm, classes,
                          normalize=False,
                          title='Confusion matrix',
                          cmap=plt.cm.Blues):
    """
    This function prints and plots the confusion matrix.
    Normalization can be applied by setting `normalize=True`.
    """
    plt.imshow(cm, interpolation='nearest', cmap=cmap)
    plt.title(title)
    plt.colorbar()
    tick_marks = np.arange(len(classes))
    plt.xticks(tick_marks, classes, rotation=45)
    plt.yticks(tick_marks, classes)

    if normalize:
        cm = cm.astype('float') / cm.sum(axis=1)[:, np.newaxis]

    thresh = cm.max() / 2.
    for i, j in itertools.product(range(cm.shape[0]), range(cm.shape[1])):
        plt.text(j, i, cm[i, j],
                 horizontalalignment="center",
                 color="white" if cm[i, j] > thresh else "black")

    plt.tight_layout()
    plt.ylabel('True label')
    plt.xlabel('Predicted label')

# Predict the values from the validation dataset
Y_pred = model.predict(X_val)
# Convert predictions classes to one hot vectors
Y_pred_classes = np.argmax(Y_pred,axis = 1)
# Convert validation observations to one hot vectors
Y_true = np.argmax(Y_val,axis = 1)
# compute the confusion matrix
confusion_mtx = confusion_matrix(Y_true, Y_pred_classes)
# plot the confusion matrix
plot_confusion_matrix(confusion_mtx, classes = range(10))
从图中可以看出,绝大部分预测是正确的,但仍有个别数字预测错误。
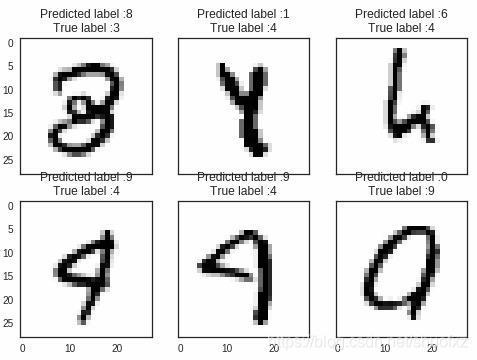
接下来调查一下造成错误的原因:
# 得到的是bool值,每一个数据是否预测正确
errors = (Y_pred_classes - Y_true != 0)
# 错误预测的预测值
Y_pred_classes_errors = Y_pred_classes[errors]
# 错误预测上各个数字预测概率
Y_pred_errors = Y_pred[errors]
# 真实值
Y_true_errors = Y_true[errors]
# 对应的图像
X_val_errors = X_val[errors]

def display_errors(errors_index,img_errors,pred_errors, obs_errors):
    """ This function shows 6 images with their predicted and real labels"""
    n = 0
    nrows = 2
    ncols = 3
    fig, ax = plt.subplots(nrows,ncols,sharex=True,sharey=True)
    for row in range(nrows):
        for col in range(ncols):
            error = errors_index[n]
            ax[row,col].imshow((img_errors[error]).reshape((28,28)))
            ax[row,col].set_title("Predicted label :{}\nTrue label :{}".format(pred_errors[error],obs_errors[error]))
            n += 1

# Probabilities of the wrong predicted numbers
Y_pred_errors_prob = np.max(Y_pred_errors,axis = 1)

# Predicted probabilities of the true values in the error set
true_prob_errors = np.diagonal(np.take(Y_pred_errors, Y_true_errors, axis=1))

# Difference between the probability of the predicted label and the true label
delta_pred_true_errors = Y_pred_errors_prob - true_prob_errors

# Sorted list of the delta prob errors
sorted_dela_errors = np.argsort(delta_pred_true_errors)

# Top 6 errors
most_important_errors = sorted_dela_errors[-6:]

# Show the top 6 errors
display_errors(most_important_errors, X_val_errors, Y_pred_classes_errors, Y_true_errors)

从图中可以看出,这些预测错误的图片,确实有很大的迷惑性,对于人来说也不一定能分辨清楚。
5 生成结果
# predict results
results = model.predict(test)

# select the indix with the maximum probability
results = np.argmax(results,axis = 1)

results = pd.Series(results,name="Label")

submission = pd.concat([pd.Series(range(1,28001),name = "ImageId"),results],axis = 1)

submission.to_csv("cnn_mnist_datagen.csv",index=False)


