python可视化(3-1)面向对象绘图(画布和子图,fig & ax)
我们进入下一个阶段:面向对象绘图
matplotlib的前身是matlab,事实上,前两章的模块调用与matlab并无差异,无非就是将matlab语法换成python语法。遵循的仍然是顺序调用,接口传参,而后得到绘图结果的过程。
而这是远远不够的,举个简单的例子,当我们得到绘图对象后,我们可能对绘图对象的横坐标尺度不够满意,比如原横坐标是每个0.1产生一个刻度,而我们需要每隔0.5产生一个尺度;有时,我们对图例是不够满意的,原图例是5行1列,而我们想将其设置为1行5列。解决这些问题,需要的是面向对象的思路,就一幅图而言,其对象由总到分可以概括为:
| 对象 | 常用代号 |
|---|---|
| 画布 | fig |
| 子图(或者坐标系) | ax |
| 绘图对象(如散点,直方、折线等) | ax.scatter、ax.hist、ax.plot |
| 坐标轴 | ax.xaxis |
| 坐标轴刻度 | ax.xaxis.xtick |
| 图例 | ax.legend |
| 轴标题 | ax.xlabel |
从表中可以看出,大多数对象都从属于ax,而ax是根植在fig基础上的,本文重点探讨fig与ax的关系
文章目录
- 单子图
- 思路一:创建画布,在画布基础上创建子图
-
- fig.add_subplot
-
- 设置坐标系
- 极坐标polar
- fig.add_axes
- 思路二:画布和子图同时创建
- 思路三:创建画布栅格
-
- 不均匀的栅格子图
- 栅格子图的合并-fig.add_subplot
- 栅格子图的合并-plt.subplot2grid
- 总结
本文的运行环境为 jupyter notebook
python版本为3.7
本文所用到的库包括
%matplotlib inline
import numpy as np
import matplotlib.pyplot as plt
from matplotlib.gridspec import GridSpec
单子图
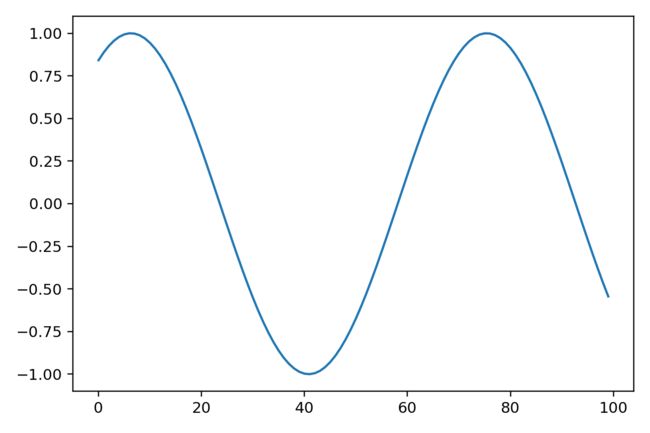
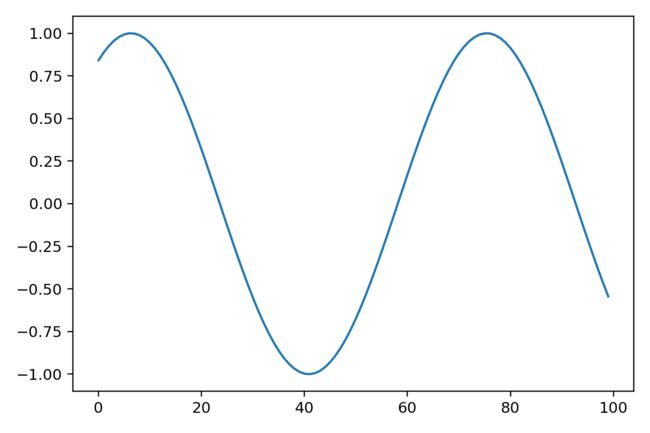
当画布上只有一副子图时,以下两段代码并无差异,plt会自动创建一副子图并绘制图像。
x=np.sin(np.linspace(1,10,100))

fig=plt.figure()
ax=fig.add_subplot(1,1,1)
ax.plot(x)
x=np.sin(np.linspace(1,10,100))

plt.plot(x)
但是,大多数情况下,我们都需要绘制多个子图,在一张画布上绘制多个子图一共分为三种思路,请往下看。
思路一:创建画布,在画布基础上创建子图
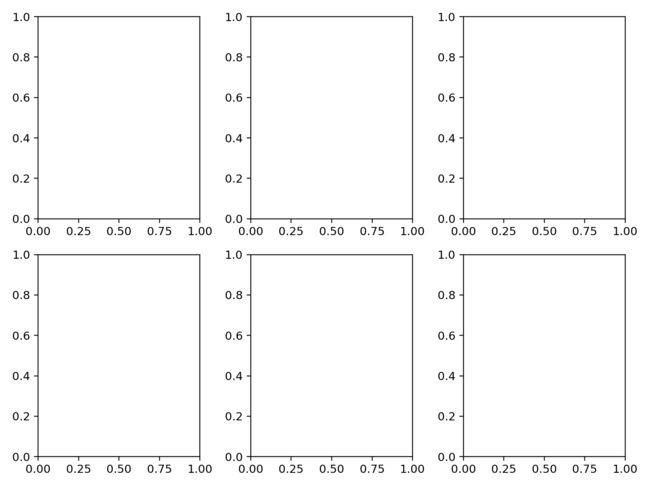
刚思路需先创建一个画布对象fig,并以此为基础,通过调用fig.add_subplot接口或fig.add_axes接口,逐个创建子图ax,后通过ax进行绘图对象的绘制及子图的修改。两者原理亦有些差别。
fig.add_subplot
nrows, ncols=2,3
fig=plt.figure(figsize=(8,6))
for i in range(nrows*ncols):
    ax=fig.add_subplot(nrows, ncols,i+1)
    ###  子图的绘制  ###
设置坐标系
需要注意的是,在创建子图时,可以根据具体需求,对子图的坐标系进行设定。
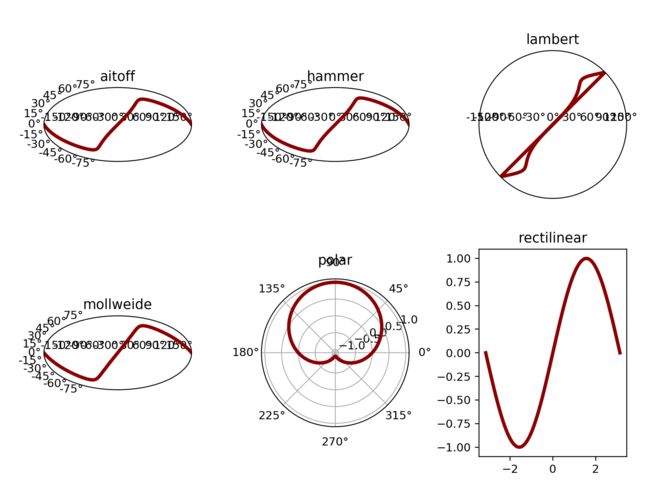
下图展示了不同坐标系下,正弦折线图的差异。从下图可知,我们常用的坐标系为rectilinear
x = np.linspace(-1.0*np.pi, np.pi, 100)
y = np.sin(x)

nrows, ncols = 2, 3
fig = plt.figure(figsize=(8, 6))
for i, projection in enumerate(['aitoff', 'hammer', 'lambert', 'mollweide', 'polar', 'rectilinear']):
    ax = fig.add_subplot(nrows, ncols, i+1, projection=projection)
    ax.plot(x, y, c='darkred', lw=3)
    ax.set_title(projection)
极坐标polar
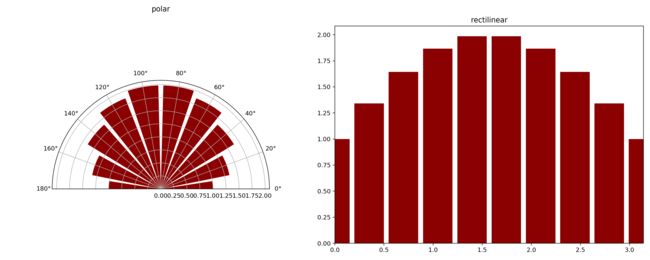
另一个常用的坐标系为极坐标系,其原理是将x,y映射为 θ和r,如图正弦曲线x浮点型数据被映射到0-180度,其高度height被映射为半径,有点像华为的LOGO。
x = np.linspace(0, np.pi, 10)
height = np.sin(x)+1

nrows, ncols = 1, 2
fig = plt.figure(figsize=(15, 6))
for i, projection in enumerate(['polar', 'rectilinear']):
    ax = fig.add_subplot(nrows, ncols, i+1, projection=projection)
    ax.bar(x=x, height=height, width=0.3, color='darkred')
    ax.set_xlim((0, np.pi))
    ax.set_title(projection)
fig.add_axes
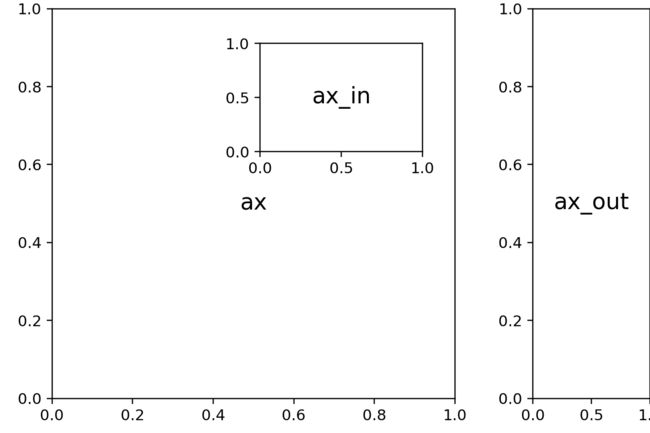
fig.add_axes接口更像是直接在一张纸上根据坐标,一个个地绘制子图。
其接口传入参数为一个矩形rect,rect包含四个数值,分别代表矩形的x,y,w,h。
x,y为子图左下角在画布上的坐标,w表示矩形宽,h表示矩形高。以上数值均为画布归一化数值。
fig = plt.figure(figsize=(6, 4))
rect = [0.08, 0.08, 0.62, 0.9]
rect_in = [0.4, 0.65, 0.25, 0.25]
rect_out = [0.82, 0.08, 0.18, 0.9]

ax = fig.add_axes(rect)
ax_in = fig.add_axes(rect_in)
ax_out = fig.add_axes(rect_out)

ax.text(0.5, 0.5, 'ax', ha='center', va='center',
        transform=ax.transAxes, fontsize=15)
ax_in.text(0.5, 0.5, 'ax_in', ha='center', va='center',
           transform=ax_in.transAxes, fontsize=15)
ax_out.text(0.5, 0.5, 'ax_out', ha='center', va='center',
            transform=ax_out.transAxes, fontsize=15)
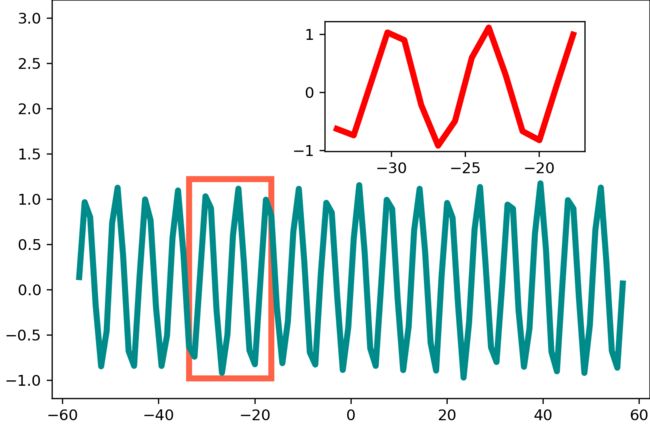
fig = plt.figure(figsize=(6, 4))
rect1 = [0.08, 0.08, 0.92, 0.92]
rect2 = [0.5, 0.65, 0.4, 0.3]

###########  ax1  #######
np.random.seed(123)
x = np.linspace(-18.0*np.pi, 18.0*np.pi, 100)
y = np.sin(x)+np.random.uniform(0, 0.2, 100)
ax1 = fig.add_axes(rect1, aspect='auto')
ax1.plot(x, y, lw=4, c='darkcyan')
ax1.set_ylim(-1.2, 3.2)
ax1.axvspan(x[20], x[35], ymin=0.05, ymax=0.55, lw=4,
            edgecolor='tomato', facecolor='white')

##########  ax2  #############
x2 = x[20:35]
y2 = y[20:35]
ax2 = fig.add_axes(rect2, aspect='auto')
ax2.plot(x2, y2, lw=4, c='red')
思路二:画布和子图同时创建
在画布(fig)上一个个地add(add_subplot,add_axes)子图,往往效率不高,plt.subplots接口很好地解决了该问题,一步生成画布,并同时生成m行,n列的子图栅格。
nrows = 4
ncols = 3
fig, axs = plt.subplots(nrows=nrows,ncols=ncols)
在此情况下,对子图的调用主要分为两种方式:
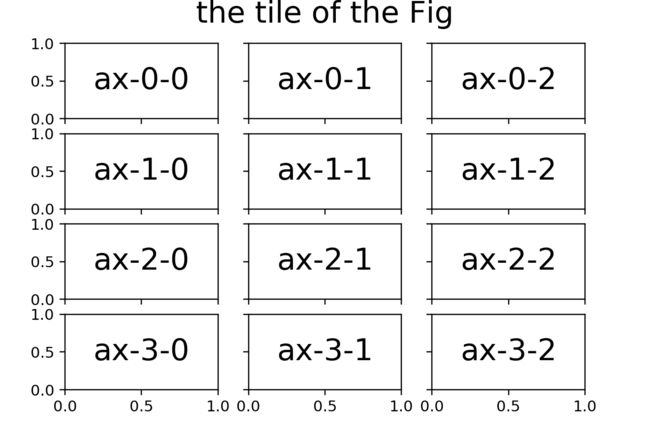
方式一:通过子图在栅格中的位置调用
axs为nrows行,ncols列的二维列表。对某个子图的调用需指定其行、列号码。
nrows = 4
ncols = 3
fig, axs = plt.subplots(nrows=nrows,
                        ncols=ncols,
                        sharex=True,
                        sharey=True,
                        squeeze=False,
                        )
# 画布标题
fig.suptitle(x=0.5,
             y=1.0,
             t='the tile of the Fig',
             size=20,
             va='top')
for i in range(nrows):
    for j in range(ncols):
        axs[i, j].text(0.5, 0.5, 'ax-%d-%d' % (i, j), ha='center',
                       va='center', fontsize=20, transform=axs[i, j].transAxes)
plt.subplots_adjust(left=0.1, right=0.9,
                    bottom=0.1, top=0.9,
                    )
方式二:按顺序对子图进行调用
因行、列号的调用方式需要嵌套两层for循环,相对复杂。若绘图序列是按顺序给予的,可将axs二维列表展平为一维列表,而后按顺序逐个调用。
nrows = 4
ncols = 3
fig, axs = plt.subplots(nrows=nrows,
                        ncols=ncols,
                        sharex=True,
                        sharey=True,
                        squeeze=False,
                        )
# 画布标题
fig.suptitle(x=0.5,
             y=1.0,
             t='the tile of the Fig',
             size=20,
             va='top')
for i, ax in enumerate(axs.ravel()):  # 将所有子图拉平成一维列表
    ax.text(0.5, 0.5, 'ax-%d' % (i), ha='center',
            va='center', fontsize=20, transform=ax.transAxes)
plt.subplots_adjust(left=0.1, right=0.9,
                    bottom=0.1, top=0.9,
                    )
思路三:创建画布栅格
另一种创建栅格的方式,是在画布的基础上,增加一个栅格对象GridSpec
该类通过以下代码调用(已在本文开头导入)
from matplotlib.gridspec import GridSpec
不均匀的栅格子图
通过传入width_ratios,height_ratios参数,可以将子图的宽高设置为不同比例。
fig = plt.figure(figsize=(8, 6))
nrows, ncols = 4, 3
gs = GridSpec(nrows, ncols,
              width_ratios=[10, 20, 10],  # 各栅格列宽度相对比例
              height_ratios=[30, 10, 20, 10],)  # 各栅格行高度相对比例

for i in range(nrows*ncols):
    ax = fig.add_subplot(gs[i])
    ax.text(0.5,0.5,'ax%d'%(i+1),ha='center',va='center',transform=ax.transAxes,fontsize=15)
栅格子图的合并-fig.add_subplot
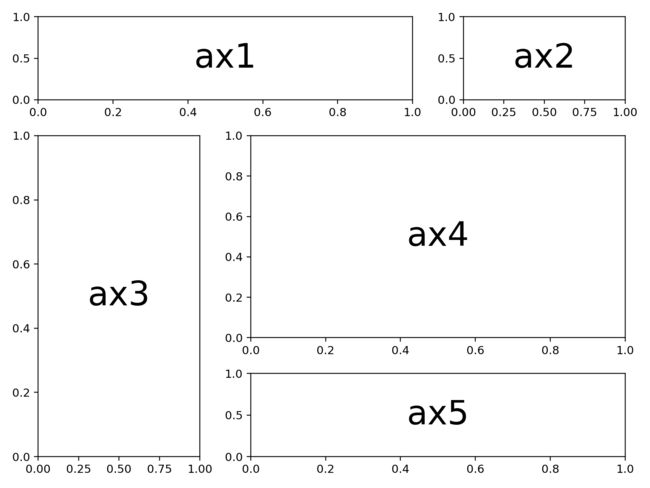
通过对栅格对象的切片操作,可以将栅格进行 列或者行的合并,如下图:
fig = plt.figure(figsize=(8, 6))
nrows, ncols = 4, 3
gs = GridSpec(nrows, ncols,
              width_ratios=[10, 20, 10],
              height_ratios=[30, 10, 20, 10],)

# rows,cols   切片形式选定子图区域,切片数值为左闭右开 和numpy数组类似
ax1 = fig.add_subplot(gs[0, 0:2])
ax2 = fig.add_subplot(gs[0, 2])
ax3 = fig.add_subplot(gs[1:4, 0])
ax4 = fig.add_subplot(gs[1:3, 1:3])
ax5 = fig.add_subplot(gs[3, 1:3])

# 标注每个子图
ax1.text(0.5, 0.5, 'ax1', ha='center', va='center',
         transform=ax1.transAxes, fontsize=30)
ax2.text(0.5, 0.5, 'ax2', ha='center', va='center',
         transform=ax2.transAxes, fontsize=30)
ax3.text(0.5, 0.5, 'ax3', ha='center', va='center',
         transform=ax3.transAxes, fontsize=30)
ax4.text(0.5, 0.5, 'ax4', ha='center', va='center',
         transform=ax4.transAxes, fontsize=30)
ax5.text(0.5, 0.5, 'ax5', ha='center', va='center',
         transform=ax5.transAxes, fontsize=30)
栅格子图的合并-plt.subplot2grid
同样的功能,通过plt.subplot2grid接口也能实现,注意其与fig.add_subplot调用时参数的不同。
fig = plt.figure(figsize=(8, 6))
rows, cols = 4, 3

ax1 = plt.subplot2grid(shape=(rows, cols), loc=(0, 0),
                       fig=fig, rowspan=1, colspan=2)
# colspan=2 表示占据2列
ax2 = plt.subplot2grid(shape=(rows, cols), loc=(0, 2),
                       fig=fig, rowspan=1, colspan=1)
ax3 = plt.subplot2grid(shape=(rows, cols), loc=(1, 0),
                       fig=fig, rowspan=3, colspan=1)
ax4 = plt.subplot2grid(shape=(rows, cols), loc=(1, 1),
                       fig=fig, rowspan=2, colspan=2)
ax5 = plt.subplot2grid(shape=(rows, cols), loc=(3, 1),
                       fig=fig, rowspan=1, colspan=2)

# 标记每个子图
ax1.text(0.5, 0.5, 'ax1', ha='center', va='center',
         fontsize=30, transform=ax1.transAxes)
ax2.text(0.5, 0.5, 'ax2', ha='center', va='center',
         fontsize=30, transform=ax2.transAxes)
ax3.text(0.5, 0.5, 'ax3', ha='center', va='center',
         fontsize=30, transform=ax3.transAxes)
ax4.text(0.5, 0.5, 'ax4', ha='center', va='center',
         fontsize=30, transform=ax4.transAxes)
ax5.text(0.5, 0.5, 'ax5', ha='center', va='center',
         fontsize=30, transform=ax5.transAxes)
总结
栅格子图的创建
批量创建m行n列 等宽、等高子图,推荐:
plt.subplots(nrows=m,ncols=n)
批量创建m行n列 不等宽、不等高子图,推荐:
GridSpec(nrows=m, ncols=n, width_ratios=*args, height_ratios=*args)
创建行列不均匀、不等宽、不等高子图,推荐:
GridSpec(nrows=m, ncols=n)
fig.add_subplot(gs[row1:row2, col1:col2])
自由创建任意位置的子图,推荐:
fig.add_axes(rect)
栅格子图的调用
精确调用:
for i in []:
    for j in []:
        axs[i,j]=*****
顺序调用:
for ax in axs.ravel():
    ax=******
plt绘图对象与ax绘图对象总结
不同绘图对象plt和ax的对比如下表,从表中可以看出,两种调用方式是没有差异的,且接口中参数也是一致的
| plt 方法 | ax 方法 |
|---|---|
| plt.plot() | ax.plot() |
| plt.scatter() | ax.scatter() |
| plt.stem() | ax.stem() |
| plt.boxplot() | ax.boxplot() |
| plt.errorbar() | ax.errorbar() |
| plt.stackplot() | ax.stackplot() |
| plt.broken_barh() | ax.broken_barh() |
| plt.step() | ax.step() |
| plt.text() | ax.text() |
| plt.hlines(),plt.vlines() | ax.hlines(),ax.vlines() |
| plt.axhline(),plt.axvline() | ax.axhline(),ax.axvline() |
| plt.axhspan(),plt.axvspan() | ax.axhspan(),ax.axvspan() |
| plt.hist() | ax.hist() |
| plt.annotate() | ax.annotate() |
| plt.fill_between() | ax.fill_between() |
那什么情况下用plt,什么情况下用ax呢?
- 绘制绘图对象而言,单一子图情况下,两者无差异,例如绘制散点图,plt.scatter() 与 ax.scatter() 无差异;
- plt的绘图坐标系为当前子图,例如当前通过ax3=fig.add_subplot(133)声明至第3个子图,此时调用plt接口则在第3个子图上进行绘制;
而对于ax而言,顾名思义,指定为哪个子图即在那个子图上绘制,如ax3.plot(),则毫无疑问,是去第三个子图绘制; - 子图的修饰。通常而言,对子图坐标、标题、轴标签、刻度等元素的修饰,大多数均是通过与ax相关的接口实现的,因此为了“精修”子图,有必要在绘制绘图对象时声明子图;
- plt.gca() 返回当前子图。
希望对你有所启发和帮助!
