Python实现条形图的绘制
说明:代码运行环境为 Win10+Python3+jupyter notebook
条形图是一种用来描绘已汇总的分类型数据的频数分布、相对频数分布或百分数频数分布。(百分数频数就是相对频数乘以100%)
绘制条形图的主要方法:
方法1:通过pandas包中的Series对象或DataFrame对象调用plot()、plot.bar()或plot.barh()方法;
方法2:通过seaborn包中的catplot()方法或barplot()方法,其中barplot()是catplot()种的参数kind='bar'的一种情况;
方法3:通过matplotlib包中的Axes对象调用bar()或barh()方法。
首先导出需要的各种包:
%matplotlib notebook
import matplotlib.pyplot as plt
import pandas as pd
import numpy as np
import seaborn as sns
方法1具体示例:
创建Series.plot.bar()要用到的数据:
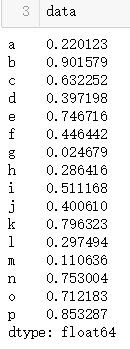
data = pd.Series(np.random.rand(16),index=list('abcdefghijklmnop'))data的表结构如下图所示:
Series.plot.bar()示例:
fig,axes = plt.subplots(2,1)
data = pd.Series(np.random.rand(16),index=list('abcdefghijklmnop'))
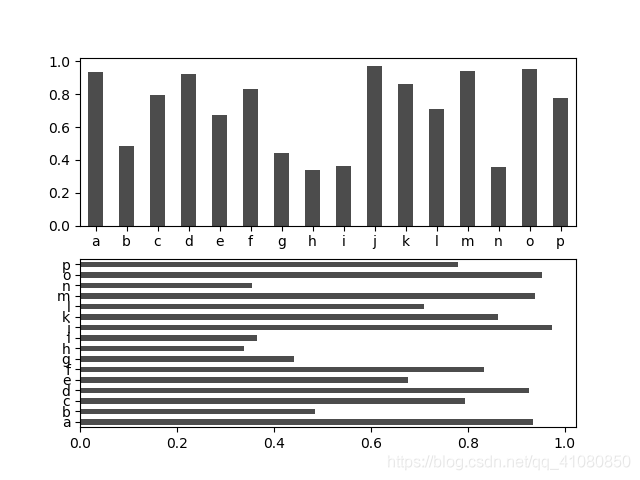
data.plot.bar(ax=axes[0],color='k',alpha=0.7,rot=0)
# 参数alpha指定了所绘制图形的透明度,rot指定类别标签偏转的角度

data.plot.barh(ax=axes[1],color='k',alpha=0.7)
# Series.plot.barh()的用法与Series.plot.bar()一样,只不过绘制的条形图是水平方向的
fig.savefig('p1.png')
上述代码绘制的图形为:
Series.plot.bar()的用法,具体参考:
https://pandas.pydata.org/pandas-docs/stable/generated/pandas.Series.plot.bar.html#pandas.Series.plot.bar
Series.plot()的用法与Series.plot.bar()类似,具体参考:
https://pandas.pydata.org/pandas-docs/stable/generated/pandas.Series.plot.html#pandas.Series.plot
构造DataFrame.plot.bar()要用到的数据:
df = pd.DataFrame(np.random.rand(6,4),
                 index=['one','two','three','four','five','six'],
                 columns=pd.Index(['A','B','C','D'],name='Genus'))
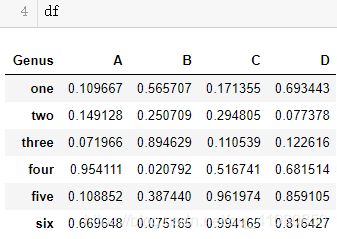
df的表结构如下图所示:
DataFrame.plot.bar()示例:
fig,axes = plt.subplots(2,2)
df.plot.bar(ax=axes[0,0],alpha=0.7,rot=0,legend=False)
df.plot.bar(ax=axes[0,1],stacked=True,alpha=0.7,rot=0)
# 参数stacked为True时,普通条形图变成堆积条形图

df.plot.barh(ax=axes[1,0],alpha=0.7,rot=0,legend=False)
df.plot.barh(ax=axes[1,1],stacked=True,alpha=0.7,rot=0,legend=False)

axes[0,0].set_title('The ordinary vertical bar plot')
axes[0,1].set_title('The stacked vertical bar plot')
axes[1,0].set_title('The ordinary horizontal bar plot')
axes[1,1].set_title('The stacked horizontal bar plot')

axes[0,1].legend(loc=2, bbox_to_anchor=(1.05,1.0),borderaxespad = -0.2)
# 为防止图例覆盖条形图,将图例放置在条形图的外面
fig.subplots_adjust(wspace=0.4,hspace=0.4)  # 调整子图之间的距离
fig.savefig('p2.png')
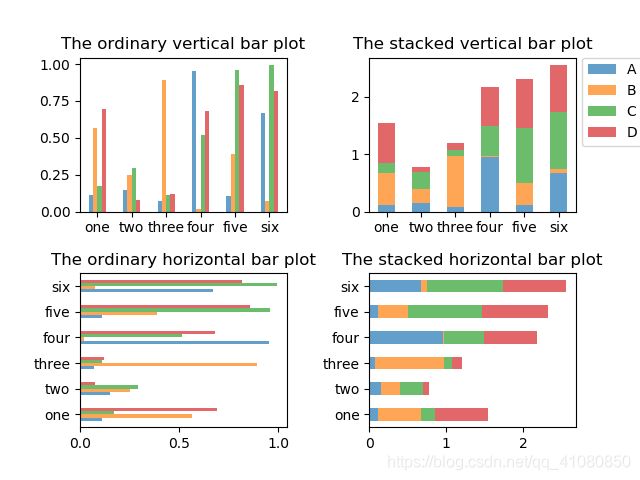
上述代码绘制的图形为:
DataFrame.plot.barh()与DataFrame.plot.bar()的用法一样,只不过绘制的条形图由垂直方向变成了水平方向;DataFrame.plot()的用法与DataFrame.plot.bar()类似。
DataFrame.plot.bar()的用法具体参考:
https://pandas.pydata.org/pandas-docs/stable/generated/pandas.DataFrame.plot.bar.html
DataFrame.plot()的用法,具体参考:
https://pandas.pydata.org/pandas-docs/stable/generated/pandas.DataFrame.plot.html
方法2具体示例:
导入seaborn.catplot()要用到的数据:
tips = pd.read_csv('examples/tips.csv')
tips = pd.read_csv('examples/tips.csv')
party_counts = pd.crosstab(tips['day'],tips['size'])
# 调用pd.crosstab()创建一个交叉表,并赋值给party_counts
party_counts的表结构如下图所示:
对数据做初步筛选:
# 选取party_counts的第二列至第五列数据
new_party_counts = party_counts.loc[:,2:5]
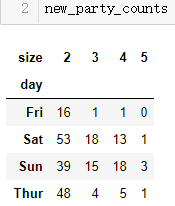
new_party_counts的表结果如下图所示:
seaborn.catplot()示例:
sns.catplot(kind='bar',data=new_party_pcts)
# 给data参数传入的数据是一个交叉表,sns.catplot()默认以交叉表的列名作为条形图x轴上的标签
# 每一个列名对应的条形图默认表示的是该列所有数据的平均数,汇总方式由参数estimator决定
# 条形图上的竖线表示平均数的置信区间,默认是%95置信区间
# 如果不想在条形图上显示置信区间,可以让参数ci的值为None

fig.savefig('p3.png')
上述代码绘制的图形为:
seaborn.catplot()的用法,具体参考:
http://seaborn.pydata.org/generated/seaborn.catplot.html?highlight=seaborn%20catplot#seaborn.catplot
seaborn.barplot()要用到的数据是tips
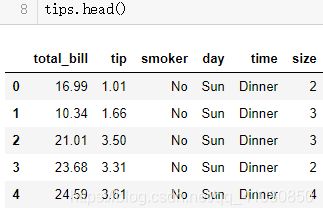
tips的表结构如下图所示:
seaborn.barplot()示例:
fig,axes = plt.subplots(2,1)
sns.barplot(x='total_bill',y='day',hue='time',orient='h',data=tips,ax=axes[0])
sns.barplot(x='day',y='total_bill',hue='time',orient='v',data=tips,ax=axes[1])

# 每一个列名对应的条形图默认表示的是该列所有数据的平均数,汇总方式由参数estimator决定
# 条形图上的竖线表示平均数的置信区间,默认是%95置信区间
# 如果不想在条形图上显示置信区间,可以让参数ci的值为None

axes[0].set_title('The horizontal barplot')
axes[1].set_title('The vertical barplot')

axes[0].legend_.remove() # 移除axes[0]上的图例
axes[1].legend(loc=5, bbox_to_anchor=(1,1.22))
# 把axes[1]的图例设置在合适的位置

fig.subplots_adjust(hspace=0.6,wspace=0.6)  # 调整各子图之间的间距
fig.savefig('p4.png')
上述代码绘制的图形为:
seaborn.barplot()的用法,具体参考:
http://seaborn.pydata.org/generated/seaborn.barplot.html#seaborn.barplot
方法3具体示例:
准备好axes.bar()方法要用到的数据:
# 以'day'列为依据,对tips进行分组
grouped = tips.groupby(tips['day'])

# 对分组后的数据进行统计求和
grouped_sum = grouped.sum()
grouped_sum的表结构如下图所示:
axes.bar()示例:
fig,axes = plt.subplots()
patches = axes.bar(x=[1,2,3,4],height=grouped_sum['total_bill'],width=0.5,
         tick_label=['Fri','Sat','Sun','Thur'])
# axes.bar()中的参数说明:
# x表示不同长方条的位置坐标
# height表示长方条的高度
# width表示长方条的宽度
# tick_label表示不同长方条对应的标签
# axes的返回值是一个容器,里面包含着所有的长方条
# axes.bar()还有一些其他参数,可以参考官方文档

axes.set_title('The sum of total_bill on different days')
axes.set_yticks(np.arange(0,2250,250))   # 设置y轴上的数值范围

# 给条形图添加数据标记
for rect in patches:
    height = rect.get_height()
    if height != 0:
        axes.text(rect.get_x() + rect.get_width()/10, height + 10,'{:.2f}'.format(height))

fig.savefig('p5.png')
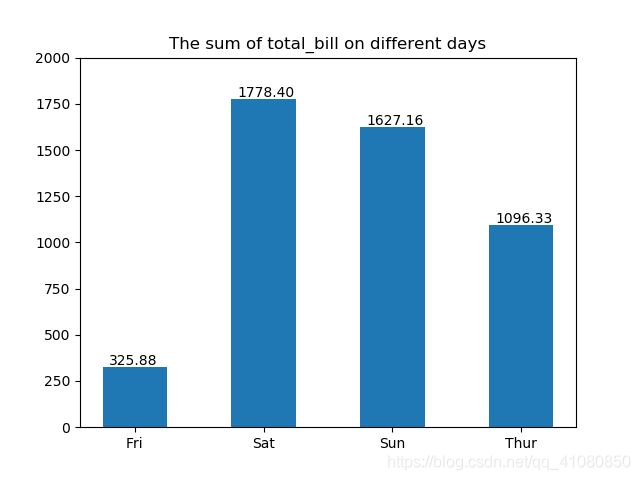
上述代码绘制的图形为:
Axes.barh()方法与Axes.bar()的用法类似,只不过Axes.barh()绘制的是水平方向的条形图。
Axes.bar()方法的用法,具体参考:
https://matplotlib.org/api/_as_gen/matplotlib.axes.Axes.bar.html?highlight=axes%20bar#matplotlib.axes.Axes.bar
其他参考资料:
《利用Python进行数据分析》第二版
《商务与经济统计》第十三版
https://matplotlib.org/api/axes_api.html?highlight=axes#module-matplotlib.axes
https://blog.csdn.net/John_xyz/article/details/54754937?locationNum=8&fps=1
https://pandas.pydata.org/pandas-docs/stable/generated/pandas.crosstab.html?highlight=pandas%20crosstab#pandas.crosstab
https://matplotlib.org/api/_as_gen/matplotlib.pyplot.subplots_adjust.html?highlight=subplots_adjust#matplotlib.pyplot.subplots_adjust
https://blog.csdn.net/qq_41080850/article/details/83790083
PS:本文为博主原创文章,转载请注明出处。
