Pyecharts学习(一)
文章目录
- 全局配置项
-
- 标题配置项
- 工具箱配置项
- 图例配置项
- 提示框配置项
- 区域缩放配置项
- 初始化配置项
- 系统配置项
- 直角坐标系图表
-
- 柱形图/条形图
- 折线图
- 散点图
- 基本图表
-
- 饼图
- 环形图
- 词云
Pyecharts功能非常强大,可以做出30多种常见的图表,在默认的配置下图表也挺好看的,基本可以满足我们的各种需求。推荐大家去 官方网站进行学习(这次网站是中文的)。
全局配置项

图片来源:https://pyecharts.org/#/zh-cn/global_options
全局配置项可通过 set_global_options 方法设置,下面以实例bar为例
import pyecharts.options as opts
标题配置项
bar.set_global_opts(title_opts = opts.TitleOpts(title="我是标题"))
工具箱配置项
bar.set_global_opts(toolbox_opts = opts.ToolboxOpts(is_show=True,orient="horizontial"))
#is_show参数表示是否展示,orient表示方向为水平还是垂直
图例配置项
bar.set_global_opts(legend_opts = opts.LegendOpts(is_show=True)#默认为True
提示框配置项
bar.set_global_opts(tooltip_Opts = opts.TooltipOpts(is_show=True,trigger="axis",axis_pointer_type="cross"))
#trigger参数表示出发类型,柱状图或者折线图多选用axis,散点图或饼图多选用item
#axis_pointer_type参数表示指示类型,line为直线指示器,shadow为阴影指示器,none表示无指示器,
cross表示十字准星指示器
区域缩放配置项
bar.set_global_opts(datazoom_Opts = opts.DataZoomOpts(type_= " ", range_start= ,range_start=))
#type_参数组件类型可选slider或者inside
#range_start表示数据窗口范围的起始百分比,范围是:0 ~ 100,表示 0% ~ 100%
#range_end表示数据窗口范围的结束百分比,范围是:0 ~ 100
初始化配置项
bar.set_global_opts(init_Opts = opts.InitOpts(width=" ",heigh=" "))
系统配置项
系统配置项需要结合具体的图表进行学习,可以参照下面的例子。
直角坐标系图表
所有直角坐标系图表都拥有以下方法:
1.扩展X/Y轴
.extend_axis()
2.新增X轴数据
.add_xaxis()
3.翻转XY轴数据
.reversal_axis()
4.层叠多图
.overlap()
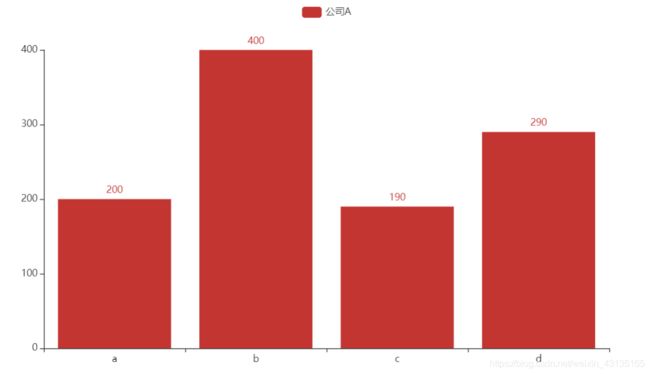
柱形图/条形图
import pyecharts.charts as pyec
x = ["a","b","c","d"]
y = [200,400,190,290]
bar = pyec.Bar()
bar.add_xaxis(x)
bar.add_yaxis(series_name="公司A",yaxis_data=y) #series_name参数一定要加
bar.render_notebook()#render译为:呈递
折线图
x = ["a","b","c","d"]
y = [200,400,190,290]
y1 = [300,400,190,230]
line = pyec.Line()
line.add_xaxis(x)
line.add_yaxis(series_name="公司A",y_axis=y)
line.add_yaxis(series_name="公司B",y_axis=y1)
line.render_notebook()
散点图
import numpy as np
x = np.linspace(0,10,20)
y = np.sin(x)

scatter = pyec.Scatter()
scatter.add_xaxis(xaxis_data=x)
scatter.add_yaxis(series_name="",
                  y_axis=y,
                  label_opts=opts.LabelOpts(is_show=False),#设置数据点是否展示
                  symbol_size=15,#控制点的大小
                  symbol="triangle"#点的形状
                  )
scatter.render_notebook()
基本图表
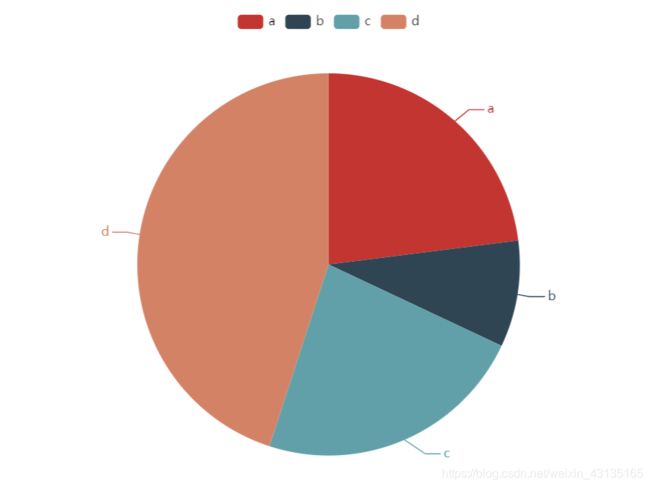
饼图
x = ["a","b","c","d"]
y = [230,90,230,450]
data_pair = list(zip(x,y))

pie = pyec.Pie()
pie.add(series_name="公司A",data_pair=data_pair)
pie.render_notebook()
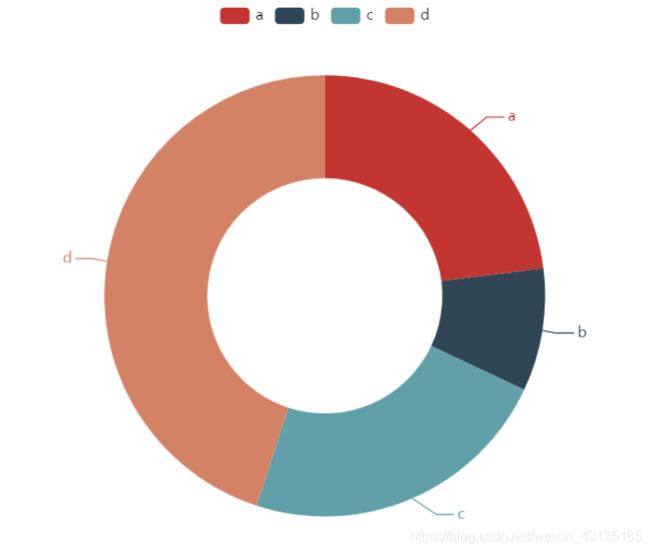
环形图
x = ["a","b","c","d"]
y = [230,90,230,450]
data_pair = list(zip(x,y))

pie = pyec.Pie()
pie.add(series_name="公司A",data_pair=data_pair,radius=["40%","75%"])
pie.render_notebook()
词云
s = '''The Zen of Python, by Tim Peters
Beautiful is better than ugly.
Explicit is better than implicit.
Simple is better than complex.
Complex is better than complicated.
Flat is better than nested.
Sparse is better than dense.
Readability counts.
Special cases aren't special enough to break the rules.
Although practicality beats purity.
Errors should never pass silently.
Unless explicitly silenced.
In the face of ambiguity, refuse the temptation to guess.
There should be one-- and preferably only one --obvious way to do it.
Although that way may not be obvious at first unless you're Dutch.
Now is better than never.
Although never is often better than *right* now.
If the implementation is hard to explain, it's a bad idea.
If the implementation is easy to explain, it may be a good idea.
Namespaces are one honking great idea -- let's do more of those!'''
s = s.lower().split()
d = {}
for i in s:
    d[i] = d.get(i,0) + 1
di = list(d.items())

import pyecharts.charts as pyec
wordcloud = pyec.WordCloud()
wordcloud.add(series_name="",data_pair=di)
wordcloud.render_notebook()


