机器学习-(02)数据处理(numpy,pandas,matplotlib,Seaborn,爬虫)
数据处理
- (1) Numpy
-
- 属性
- 创建
- 基本运算
- 索引
- 合并
- 分割
- Copy&Deep Copy
- Numpy与List
- (2) pandas
-
- 基本使用
- 选择数据
- 设置值
- 处理丢失数据
- 导入与导出
- concat合并
- merge合并
- plot绘图
- Pandas与Numpy
- (3)Matplotlib
-
- 基本使用
-
- figure图像
- 设置坐标轴
- Legend图例
- Annotation标注
- tick能见度
- 画图种类
-
- Scatter散点图
- Bar柱状图
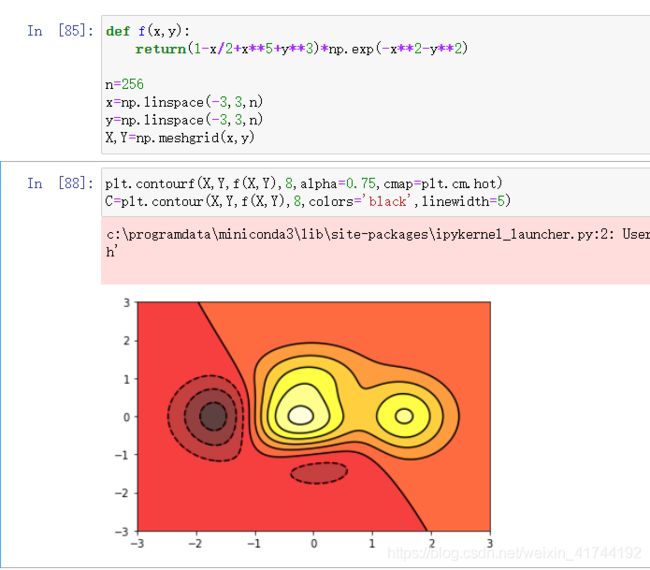
- Contours等高线
- Image图片
- 3D数据
- 多图显示
-
- Subplot多合一
- Subplot分格
- 图中图
- 次坐标轴
- 动态图像
- matplotlib不显图问题
- (4)Seaborn
- (5)高级爬虫
-
- 网页爬取
- 对本地文件的操作
(1) Numpy
NumPy是Python语言的一个扩充程序库。支持高级大量的维度数组与矩阵运算,此外也针对数组运算提供大量的数学函数库
属性
#新建数组
import numpy as np
array = np.array([[1,2,3],[2,3,4]])
#维度
print(array.ndim)
#行列数
print(array.shape)
#元素数
print(array.size)
#数据类型
print(array.dtype)
创建
#数据类型可选 int float....
a = np.array([[2,3,4],[4,5,6]],dtype=np.float64)
#特定的矩阵创建
#0矩阵
a=np.zeros((3,4))
#1矩阵
a=np.ones((3,4))
#空矩阵
a=np.empty((3,4))
#等差数组
a=np.arange((2,12,2))
#等差矩阵
a=np.arange(12).reshape((3,4))
#线性矩阵
a=np.linspace(1,10,6).reshape((2,3))
基本运算
a = np.array([10,20,30,40])
b = np.arange(4)
#加法
c=a+b
#平方
c=b**2
#三角函数
c=np.sin(a)
#判断
print(b<3)
print(b==3)
#乘法
#对应脚标相乘
c=a*c
#矩阵乘法
c=np.dot(a,c)
c=a.dot(c)
#随机矩阵
c=np.random.random((2,4))
#数值操作
#行1列0
#求和
print(np.sum(a,axis=0))
#极大值
print(np.sum(a,axis=1))
#极小值
print(np.min(a))
#最小的数脚标
np.argmin(A)
#求平均
print(np.mean(A))
print(np.average(A))
#中间值
print(np.median(A))
#顺序累加
print(np.cumsum(A))
#顺序累差
print(np.diff(A))
#单组排序
print(np.nonzero(A))
#转至矩阵
print(np.transpose(A))
print(A.T)
#转至乘积
print((A.T).dot(A))
#判断——>更新
#>9变9,,<5变5
print(np.clip(A,5,9))
索引
A = np.arange(3,15).reshape(3,4)

array([[ 3,  4,  5,  6],
       [ 7,  8,  9, 10],
       [11, 12, 13, 14]])
合并
import numpy as np
A=np.array([1,1,1])
B=np.array([2,2,2])
#上下合并
c=np.vstack([2,2,2])
#左右合并
c=np.hstack((A,B))
#行转列
print(A[:,np.newaxis])
分割
Copy&Deep Copy
![]()
Numpy与List
相同之处:
都可以用下标访问元素,例如a[0]
都可以切片访问,例如a[1:3]
都可以使用for循环进行遍历
不同之处:
Numpy之中每个元素类型必须相同;而List中可以混合多个类型元素
Numpy使用更方便,封装了许多函数,例如mean、std、sum、min、max等
Numpy可以是多维数组
Numpy用C实现,操作起来速度更快
(2) pandas
Pandas是基于Numpy 的一种工具,该工具是为了解决数据分析任务而创建的。Pandas 纳入了大量库和一些标准的数据模型,提供了高效地操作大型数据集所需的工具。Pandas提供了大量能使我们快速便捷地处理数据的函数和方法。
Pandas有两种结构,分别是Series和DataFrame。其中Series拥有Numpy的所有功能,可以认为是简单的一维数组;而DataFrame是将多个Series按列合并而成的二维数据结构,每一列单独取出来是一个Series。
基本使用
一维数组

日期范围

二维随机(索引)

行列(范围)数组

自动分布
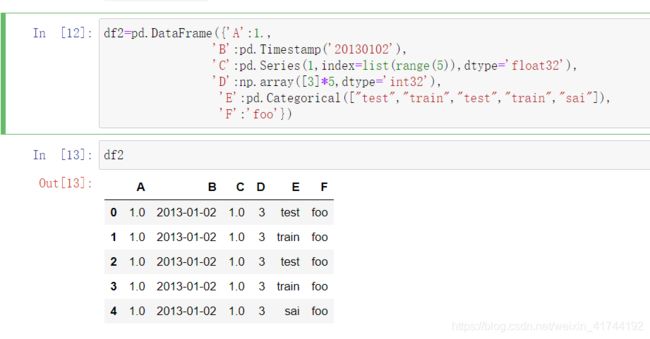
相关属性


选择数据
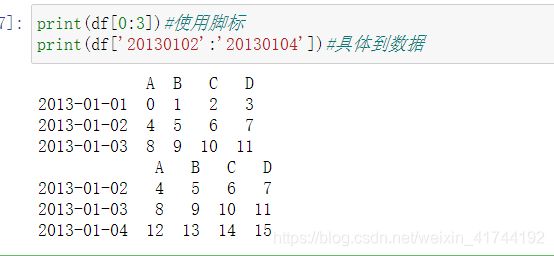
dates=pd.date_range('2013',periods=6)
df=pd.DataFrame(np.arange(24).reshape((6,4)),index=dates,columns=['A','B','C','D'])
#等价选择
print(df['A'],df.A)
print(df[0:3])#使用脚标
print(df['20130102':'20130104'])#具体到数据
#loc切片索引
print(df.loc['20130102'])
print(df.loc[:,['A','B']])
print(df.loc['20130102',['A','B']])
#iloc切片索引
print(df.iloc[3,1])
df.iloc[2,2]=1111
设置值
处理丢失数据
导入与导出
concat合并
import pandas as pd
import numpy as np
df1 = pd.DataFrame(np.ones((3,4))*0,columns=['a','b','c','d'])
df2 = pd.DataFrame(np.ones((3,4))*1,columns=['a','b','c','d'])
df3 = pd.DataFrame(np.ones((3,4))*2,columns=['a','b','c','d'])
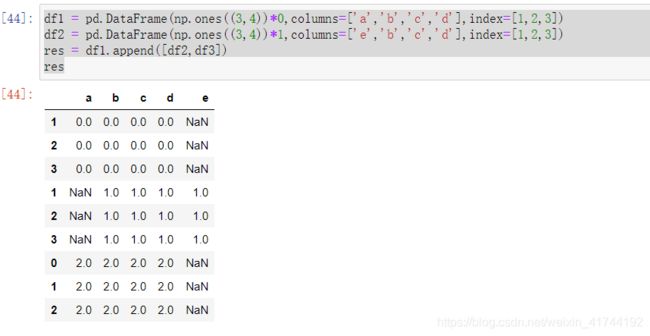
df1 = pd.DataFrame(np.ones((3,4))*0,columns=['a','b','c','d'],index=[1,2,3])
df2 = pd.DataFrame(np.ones((3,4))*1,columns=['e','b','c','d'],index=[1,2,3])
df1 = pd.DataFrame(np.ones((3,4))*0,columns=['a','b','c','d'],index=[1,2,3])
df2 = pd.DataFrame(np.ones((3,4))*1,columns=['e','b','c','d'],index=[1,2,3])
res = df1.append(df2,ignore_index=True)
res
df1 = pd.DataFrame(np.ones((3,4))*0,columns=['a','b','c','d'],index=[1,2,3])
df2 = pd.DataFrame(np.ones((3,4))*1,columns=['e','b','c','d'],index=[1,2,3])
res = df1.append([df2,df3])
res
df1 = pd.DataFrame(np.ones((3,4))*0,columns=['a','b','c','d'],index=[1,2,3])
s1 = pd.Series([1,2,3,4],index=['a','b','c','d'])
res = df1.append(s1,ignore_index=True)
res
merge合并
left = pd.DataFrame({
     'key1':['K1','K1','K1','K3'],
                     'key2':['K1','K1','K1','K3'],
                    'A':['A0','A1','A2','A3'],
                    'B':['B0','B1','B2','B3']})
left
right = pd.DataFrame({
     'key1':['K2','K2','K2','K3'],
                      'key2':['K2','K2','K2','K3'],
                     'C':['C0','C1','C2','C3'],
                     'D':['D0','D1','D2','D3']})
right
res = pd.merge(left,right,on=['key1','key2'],how='left')#left right inner outer
plot绘图
import pandas as pd
import numpy as np
import matplotlib.pyplot as plt
data  = pd.Series(np.random.randn(1000),index=np.arange(1000))
data = data.cumsum()
data.plot()
data = pd.DataFrame(np.random.randn(1000,4),index=np.arange(1000),columns=list("ABCD"))
print(data.head())
data = data.cumsum()
print(data.head())
data.plot()#plot含有多个表格属性 bar ,box,kde,area,scatter等
ax = data.plot.scatter(x='A',y='B',color='Red',label='Class 1')
data.plot.scatter(x='A',y='C',color='Green',label='Class 2',ax=ax)
Pandas与Numpy
相同之处:
访问元素一样,可以使用下标,也可以使用切片访问
可以使用For循环遍历
有很多方便的函数,例如mean、std、sum、min、max等
可以进行向量运算
用C实现,速度更快
不同之处:
Pandas拥有Numpy一些没有的方法,例如describe函数。其主要区别是:Numpy就像增强版的List,而Pandas就像列表和字典的合集,Pandas有索引。
(3)Matplotlib
基本使用
figure图像
figure语法说明
figure(num=None, figsize=None, dpi=None, facecolor=None, edgecolor=None, frameon=True)
- num:图像编号或名称,数字为编号 ,字符串为名称
- figsize:指定figure的宽和高,单位为英寸;
- dpi参数指定绘图对象的分辨率,即每英寸多少个像素,缺省值为80 1英寸等于2.5cm,A4纸是 21*30cm的纸张
- facecolor:背景颜色
- edgecolor:边框颜色
- frameon:是否显示边框

多函数显示

设置坐标轴
Legend图例
Annotation标注
#画出基本图
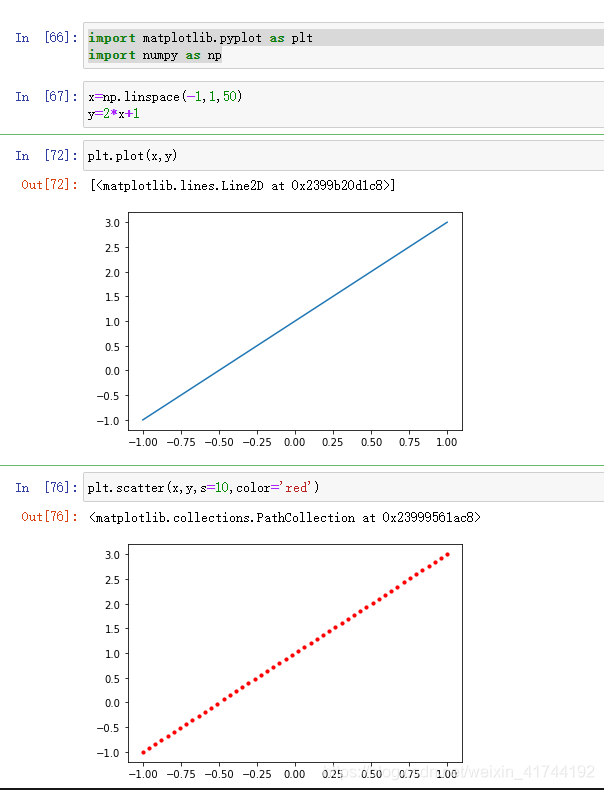
x = np.linspace(-3, 3, 50)
y = 2*x + 1
plt.figure(num=1, figsize=(8, 5))
plt.plot(x, y)

#去除边框
ax = plt.gca()
ax.spines['right'].set_color('none')
ax.spines['top'].set_color('none')

#移动坐标轴
ax.spines['bottom'].set_position(('data', 0))
ax.spines['left'].set_position(('data', 0))

#画出虚线
#点(x0,0)到(x0,y0)
x=2
y= 2*x + 1
plt.plot([x, x], [0, y], 'k--', linewidth=2.5)

#标出点
plt.scatter([x], [y], s=50, color='r')

#添加注释
plt.annotate(r'$2x+1=%s$' % y, xy=(x, y), xycoords='data', xytext=(+30, -30),
             textcoords='offset points', fontsize=16,
             arrowprops=dict(arrowstyle='->', connectionstyle="arc3,rad=.2"))
#其中参数xycoords='data' 是说基于数据的值来选位置,
#xytext=(+30, -30) 和textcoords='offset points' 对于标注位置的描述 和 xy 偏差值, arrowprops是对图中箭头类型的一些设置.
#--------------------------------------------------------------------------------
#添加注释text
plt.text(-3.7, 3, r'$This\ is\ the\ some\ text. \mu\ \sigma_i\ \alpha_t$',
         fontdict={
     'size': 16, 'color': 'r'})
tick能见度
当图片中的内容较多,相互遮盖时,可以通过设置相关内容的透明度来使图片更易于观察,也即是通过本节中的bbox参数设置来调节图像信息.
import matplotlib.pyplot as plt
import numpy as np

x = np.linspace(-3, 3, 50)
y = 0.1*x

plt.figure()
#  zorder 给出图像的透明度
plt.plot(x, y, linewidth=10, zorder=1)
plt.ylim(-2, 2)

#移动坐标轴
ax = plt.gca()
ax.spines['right'].set_color('none')
ax.spines['top'].set_color('none')
ax.spines['bottom'].set_position(('data', 0))
ax.spines['left'].set_position(('data', 0))

#给遮挡的坐标添加白色坐标背景
for label in ax.get_xticklabels() + ax.get_yticklabels():
    label.set_fontsize(12)
    label.set_bbox(dict(facecolor='white', edgecolor='None', alpha=0.7, zorder=2))
#其中label.set_fontsize(12)重新调节字体大小,bbox设置目的内容的透明度相关参,
#facecolor调节 box 前景色,edgecolor 设置边框, 本处设置边框为无,alpha设置透明度
画图种类
Scatter散点图
Bar柱状图
Contours等高线
Image图片
3D数据
from mpl_toolkits.mplot3d import Axes3D
fig=plt.figure()
ax=Axes3D(fig)
X=np.arange(-4,4,0.25)
Y=np.arange(-4,4,0.25)
X,Y=np.meshgrid(X,Y)
R=np.sqrt(X**2+Y**2)
Z=np.sin(R)
ax.plot_surface(X,Y,Z,rstride=1,cstride=1,cmap=plt.get_cmap('rainbow'))
ax.contour(X,Y,Z,zdir='z',offset=-1.5,cmap='rainbow')
ax.set_zlim(-2,2)
多图显示
Subplot多合一
plt.subplot(2,2,1)
plt.plot([0,1],[0,1])

plt.subplot(2,2,2)
plt.plot([0,1],[0,2])

plt.subplot(2,2,3)
plt.plot([0,1],[0,3])

plt.subplot(2,2,4)
plt.plot([0,1],[0,4])
Subplot分格
plt.subplot(2,1,1)
plt.plot([0,1],[0,1])

plt.subplot(2,3,4)
plt.plot([0,1],[0,2])

plt.subplot(2,3,5)
plt.plot([0,1],[0,3])

plt.subplot(2,3,6)
plt.plot([0,1],[0,4])
import matplotlib.pyplot as plt
import matplotlib.gridspec as gridspec

plt.figure()
gs=gridspec.GridSpec(3,3)
ax1=plt.subplot(gs[0,:2])
plt.plot([0,1],[0,1])
ax2=plt.subplot(gs[1,:2])
plt.plot([0,1],[0,1])
ax3=plt.subplot(gs[0:,2])
plt.plot([0,1],[0,1])
ax4=plt.subplot(gs[2,0])
plt.plot([0,1],[0,1])
ax5=plt.subplot(gs[2,1])
plt.plot([0,1],[0,1])
plt.tight_layout()
f,((ax11,ax12),(ax21,ax22))=plt.subplots(2,2,sharex=True,sharey=True)
ax11.scatter([1,2],[1,2])
ax12.scatter([1,2],[1,2])
ax21.scatter([1,2],[1,2])
ax22.scatter([1,2],[1,2])
plt.tight_layout()
图中图
fig=plt.figure()
x=[1,2,3,4,5,6,7]
y=[1,3,4,2,5,8,6]

left,bottom,width,height=0.1,0.1,0.9,0.9
ax1=fig.add_axes([left,bottom,width,height])
ax1.plot(x,y,'r')
ax1.set_xlabel('x')
ax1.set_ylabel('y')
ax1.set_title('title')

left,bottom,width,height=0.2,0.6,0.25,0.25
ax1=fig.add_axes([left,bottom,width,height])
ax1.plot(x,y,'b')
ax1.set_xlabel('x')
ax1.set_ylabel('y')
ax1.set_title('title2')

left,bottom,width,height=0.7,0.15,0.25,0.25
ax1=fig.add_axes([left,bottom,width,height])
ax1.plot(x,y,'g')
ax1.set_xlabel('x')
ax1.set_ylabel('y')
ax1.set_title('title3')
![]()
次坐标轴
动态图像
#弹出窗口
%matplotlib Tk

import numpy as np
import matplotlib.pyplot as plt
from matplotlib import animation


fig,ax=plt.subplots()
x=np.arange(0,2*np.pi,0.01)
line,=ax.plot(x,np.sin(x))


def animate(i):
    line.set_ydata(np.sin(x+i/100))
    return line,

def init():
    line.set_ydata(np.sin(x))
    return line,
ani = animation.FuncAnimation(fig=fig,func=animate,frames=100,init_func=init,interval=20,blit=True)
matplotlib不显图问题
有些时候matplotlib 的绘图没法显示在notebook中,或者显示不了。这与backend有关。
首先启动你的notebook,输入%pylab,查看你的matplotlib后端,我的输出为:TkAgg

这是后端的渲染方式,使用的是qt5渲染。激活方式为在绘图之前插入代码段:
%matplotlib Tk
(4)Seaborn
Seaborn是基于matplotlib的图形可视化python包。它提供了一种高度交互式界面,便于用户能够做出各种有吸引力的统计图表。
Seaborn是在matplotlib的基础上进行了更高级的API封装,从而使得作图更加容易,在大多数情况下使用seaborn能做出很具有吸引力的图,而使用matplotlib就能制作具有更多特色的图。应该把Seaborn视为matplotlib的补充,而不是替代物。同时它能高度兼容numpy与pandas数据结构以及scipy与statsmodels等统计模式。
Seaborn基本使用总结
(5)高级爬虫
网页爬取
获取网络数据的方式有哪些呢?
方式1:浏览器提交请求—>下载网页代码—>解析成页面
方式2:模拟浏览器发送请求(获取网页代码)->提取有用的数据->存放于数据库或文件中
爬虫要做的就是方式2。
1、发起请求
使用http库向目标站点发起请求,即发送一个Request
Request包含:请求头、请求体等
Request模块缺陷:不能执行JS 和CSS 代码
2、获取响应内容
如果服务器能正常响应,则会得到一个Response
Response包含:html,json,图片,视频等
3、解析内容
解析html数据:正则表达式(RE模块),第三方解析库如Beautifulsoup,pyquery等
解析json数据:json模块
解析二进制数据:以wb的方式写入文件
4、保存数据
数据库(MySQL,Mongdb、Redis)、文件
Python爬虫的N种姿势
对本地文件的操作
批量重命名(可正则)
import os
import re
fileList = os.listdir(r"F:\test")

# 输出此文件夹中包含的文件名称
for str_file in fileList:
    print(str_file)

# 将当前工作目录修改为待修改文件夹的位置
os.chdir(r"F:\test")
# 得到进程当前工作目录
currentpath = os.getcwd()
print("当前工作路径为:"+currentpath)

num = 1
# 遍历文件夹中所有文件
for fileName in fileList:
	# 匹配文件名正则表达式
    # pat = ".+\.(mp3)"
    # 进行匹配
    pattern = re.findall(pat, fileName)
    # 文件重新命名
    #os.rename(fileName, (str(num + 839) + '.' + pattern[0]))
    # 根据要求自定义文件重新命名
    os.rename(fileName,(str(num) +fileName))
    # 改变编号,继续下一项
    num = num + 1
print("***************************************")
fileList = os.listdir(r"F:\test")
for str_file in fileList:
    print(str_file)


