doc---vue-cli脚手架项目问题总结(16)——vue使用第三方插件库
##、vue项目中引入三方js库粘贴板的方法
![]()

<script>
    import swiper from '../lib/swiper-3.4.0.jquery.min';
    export default {

        name:'focusimg',
        mounted:function(){

            this.$nextTick(function(){

                 /* 焦点图 */
                var mySwiper = new Swiper ('.swiper-container', {

                    direction: 'horizontal',
                    loop: true,

                    // 如果需要分页器
                    pagination: '.swiper-pagination',

                    // 如果需要前进后退按钮
                    /* nextButton: '.swiper-button-next',
                    prevButton: '.swiper-button-prev',   */
                    grabCursor: true,
                    paginationClickable: true,
                    spaceBetween: 30,
                    centeredSlides: true,
                    autoplay: 2500
                });
            })
        }
    }
</script>
<style>
    @import '../css/swiper-3.4.0.min.css';
</style>
##、vue-cli中使用UEditor富文本编辑器
1、在 http://ueditor.baidu.com/website/download.html#ueditor 下UEditor 包。

2、解压之后放入脚手架的static文件下
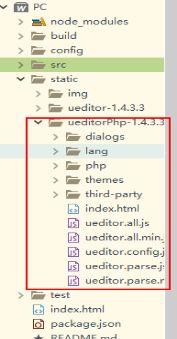
3、修改 static下的UEditor文件夹中的 ueditor.config.js 文件,添加一行代码:
window.UEDITOR_HOME_URL = "./static/ueditorPhp-1.4.3.3/"
文件名是根据自己的static下面的文件名来写。

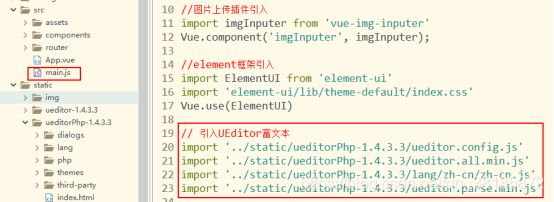
4、在main.js中引入UEditor
import '../static/ueditorPhp-1.4.3.3/ueditor.config.js'
import '../static/ueditorPhp-1.4.3.3/ueditor.all.min.js'
import '../static/ueditorPhp-1.4.3.3/lang/zh-cn/zh-cn.js'
import '../static/ueditorPhp-1.4.3.3/ueditor.parse.min.js'
5、开发一公共组件

<template>
	<div>
		<script id="editor" type="text/plain"></script>
	</div>
</template>
<script>
	export default {

		name: 'UE',
		data() {

			return {

				editor: null
			}
		},
		props: {

			defaultMsg: {

				type: String
			},
			config: {

				type: Object
			}
		},
		mounted() {

			const _this = this;
			this.editor = UE.getEditor('editor', this.config); // 初始化UE
			this.editor.addListener("ready", function() {

				_this.editor.setContent(_this.defaultMsg); // 确保UE加载完成后,放入内容。
			});
		},
		methods: {

			getUEContent() {
      // 获取内容方法
				return this.editor.getContent()
			}
		},
		destroyed() {

			this.editor.destroy();
		}
	}
</script>
<style></style>
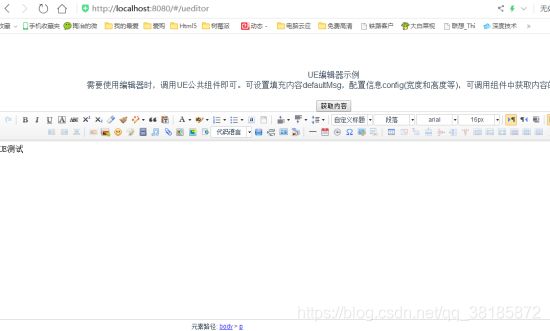
6、当我们需要使用富文本编辑器时,直接调用公共组件即可
<template>
	<div class="ueditor">
		<div class="info">UE编辑器示例<br>需要使用编辑器时,调用UE公共组件即可。可设置填充内容defaultMsg,配置信息config(宽度和高度等),可调用组件中获取内容的方法。</div>
		<button @click="getUEContent()">获取内容</button>
		<div class="editor-container">
			<UE :defaultMsg='defaultMsg' :config="config" ref="ue"></UE>
		</div>
	</div>
</template>

<script>
	import UE from '@/components/_UEditor/editor.vue';
	export default {

		name:"ueditor",
		components: {
     UE},
		data(){

			return {

				defaultMsg: '这里是UE测试',
		        config: {

		          	initialFrameWidth: null,
		          	initialFrameHeight: 350
		        }
			}
		},
		methods: {

	      	getUEContent() {
         //获取富文本内容
	        	let content = this.$refs.ue.getUEContent();
	        	this.$notify({

	          		title: '获取成功,可在控制台查看!',
	          		message: content,
	          		type: 'success'
	        	});
	        	console.log(content)
	      	}
	    }
	}
</script>

<style>

/*富文本编辑器样式*/
.info{

    border-radius: 10px;
    line-height: 20px;
    padding: 10px;
    margin: 10px;
    background-color: #ffffff;
}
</style>
7、展示富文本
##、网页音效简易解决方案audiosprite
一、当网页需要的播放声音片段过多,这个时候就会采用和css精灵图类似的技术,来拼接声音片段(audioSprite ),来减少请求。
二、自己用原生播放声音,兼容性问题,无法播放雪碧片段声音。
Howler.js 是一个不错的HTML5声音引擎。功能强大,性能不错,用起来也很方便。
最终解决:
大概就是用 audioSprite 来生成集合声音片段,然后使用howler.js 来处理、控制播放等。
1、全局安装audiosprite
npm install -g audiosprite
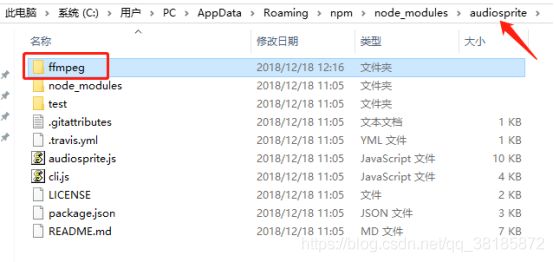
2、安装audiosprite 依赖的音频处理工具 ffmpeg;
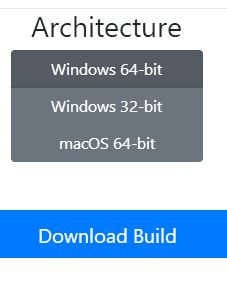
下载ffmpeg文件:https://ffmpeg.zeranoe.com/builds/
放置到audiosprite的文件夹下
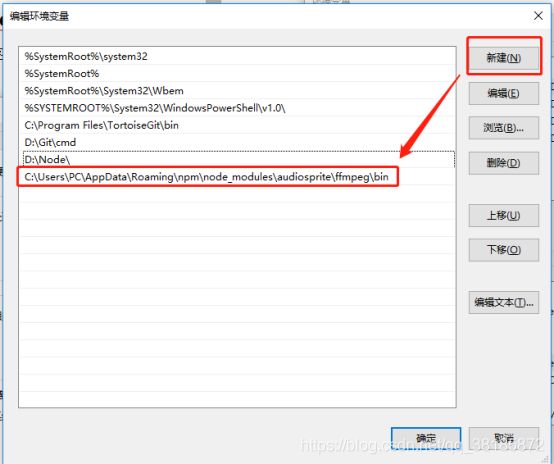
3、配置path环境(window)

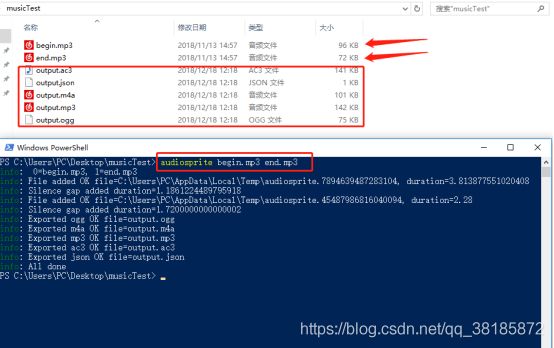
4、运行audiosprite生成集合声音片段
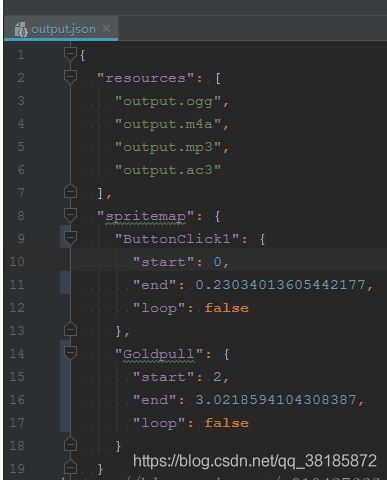
在音乐文件夹下执行audiosprite ***.mp3 ***.mp3进行整合音乐生成随后的文件;整合成功之后有如下的json 文件,它会记录声音的开始、结束状态。
5、vue单页面上使用
//  egg
import {
     Howl, Howler} from 'howler';
// Setup the new Howl.
const sound = new Howl({

  	src: ['sound.webm', 'sound.mp3']
});
// Play the sound.
sound.play();
// Change global volume.
Howler.volume(0.5);

//  egg2
// 注意这个数值里的时间第二个参数是经历的时间(毫秒数)
import {
     Howl, Howler} from 'howler'
const sound = new Howl({

    src: ['../../../../static/audio/output.mp3'],
    sprite: {

        beep: [0, 230],
        boop: [2000, 3021]
    }
})
setInterval(() => {

    sound.play('boop')
}, 3000)

// 利用stop 来停止播放
sound.stop()
6、howler的安装
查看https://www.npmjs.com/package/howler文档,安装howler:npm install howler
##、vue单页面项目中使用Echarts图表
1.安装echarts依赖
npm install echarts -S
或者使用国内的淘宝镜像:
安装
npm install -g cnpm --registry=https://registry.npm.taobao.org
使用
cnpm install echarts -S
2、在mian.js中全局引入
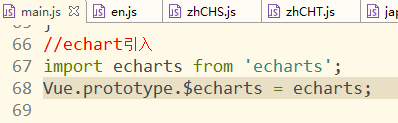
//echart引入
import echarts from 'echarts';
Vue.prototype.$echarts = echarts;
3、封装chart组件(echarts初始化应在钩子函数mounted()中)
<!-- echarts
Created by TaoYe on 2019-02-21.
Copyright 2019 TaoYe. All rights reserved.
-->
<template>
<div class="echarts">
<div id="myChart" style="width: 100%; height: 400px"></div>
</div>
</template>
<script>
export default({
name: "echarts",
data(){
return{
myChart : null,
chartOption: null,
upColor : '#00da3c',
downColor : '#ec0000',
}
},
props: ['chartData'],
created(){
},
mounted(){
let that = this;
that.$nextTick(() => {
that.init();
})
},
methods:{
reload(){
location.reload();
},
init(){
let that = this;
that.$nextTick(() => {
that.myChart = that.$echarts.init(document.getElementById("myChart"))
//that.myChart.clear();
that.drawChart();
if (that.chartOption && typeof that.chartOption === "object") {
that.myChart.setOption(that.chartOption, true);
}
})
},
splitData(rawData) {
var categoryData = [];
var values = [];
var volumes = [];
for (var i = 0; i < rawData.length; i++) {
categoryData.push(rawData[i].splice(0, 1)[0]);
values.push(rawData[i]);
volumes.push([i, rawData[i][4], rawData[i][0] > rawData[i][1] ? 1 : -1]);
}
return {
categoryData: categoryData,
values : values,
volumes : volumes
};
},
calculateMA(dayCount, data) {
var result = [];
for (var i = 0, len = data.values.length; i < len; i++) {
if (i < dayCount) {
result.push('-');
continue;
}
var sum = 0;
for (var j = 0; j < dayCount; j++) {
sum += data.values[i - j][1];
}
result.push(+(sum / dayCount).toFixed(3));
}
return result;
},
drawChart(){
let that = this;
// that.$axios.get('./echartJson.json').then(rawData=>{
let data = that.splitData(that.chartData);
that.myChart.setOption(that.chartOption = {
backgroundColor: '#fff',
animation: true,
// legend: {
// bottom: 10,
// left: 'center',
// data: ['Dow-Jones index', 'MA5', 'MA10', 'MA20', 'MA30']
// },
tooltip: {
trigger: 'axis',
axisPointer: {
type: 'cross'
},
backgroundColor: 'rgba(245, 245, 245, 0.8)',
borderWidth: 1,
borderColor: '#ccc',
padding: 10,
textStyle: {
color: '#000'
},
position: function (pos, params, el, elRect, size) {
var obj = {
top: 10};
obj[['left', 'right'][+(pos[0] < size.viewSize[0] / 2)]] = 30;
return obj;
}
},
axisPointer: {
link: {
xAxisIndex: 'all'},
label: {
backgroundColor: '#777'
}
},
toolbox: {
feature: {
dataZoom: {
yAxisIndex: false
},
brush: {
type: ['lineX', 'clear']
}
}
},
brush: {
xAxisIndex: 'all',
brushLink : 'all',
outOfBrush: {
colorAlpha: 0.1
}
},
visualMap: {
show: false,
seriesIndex: 5,
dimension: 2,
pieces: [{
value: 1,
color: that.downColor
}, {
value: -1,
color: that.upColor
}]
},
grid: [
{
left: '15%',
right: '5%',
top: '10%',
height: '50%'
},
{
left: '10%',
right: '8%',
top: '63%',
height: '16%'
}
],
xAxis: [
{
type : 'category',
data : data.categoryData,
scale: true,
boundaryGap : false,
axisLine : {
onZero: false},
splitLine: {
show: false},
splitNumber: 20,
min: 'dataMin',
max: 'dataMax',
axisPointer: {
z: 100
}
},
{
type : 'category',
gridIndex: 1,
data : data.categoryData,
scale: true,
boundaryGap : false,
axisLine : {
onZero: false},
axisTick : {
show: false},
splitLine: {
show: false},
axisLabel: {
show: false},
splitNumber: 20,
min: 'dataMin',
max: 'dataMax'
}
],
yAxis: [
{
scale: true,
splitArea: {
show: true
}
},
{
scale: true,
gridIndex : 1,
splitNumber: 2,
axisLabel: {
show: false},
axisLine : {
show: false},
axisTick : {
show: false},
splitLine: {
show: false}
}
],
dataZoom: [
{
type : 'inside',
xAxisIndex: [0, 1],
start: 90,
end : 100
},
{
show : true,
xAxisIndex: [0, 1],
type : 'slider',
top : '85%',
start: 90,
end : 100
}
],
series: [
{
name: 'Dow-Jones index',
type: 'candlestick',
data: data.values,
itemStyle: {
normal: {
color: that.upColor,
color0: that.downColor,
borderColor: null,
borderColor0: null
}
},
tooltip: {
formatter: function (param) {
param = param[0];
return [
'Date: ' + param.name + '
',
'Open: ' + param.data[0] + '
',
'Close: ' + param.data[1] + '
',
'Lowest: ' + param.data[2] + '
',
'Highest: ' + param.data[3] + '
'
].join('');
}
}
},
{
name: 'MA5',
type: 'line',
data: that.calculateMA(5, data),
smooth: true,
lineStyle: {
normal: {
opacity: 0.5}
}
},
{
name: 'MA10',
type: 'line',
data: that.calculateMA(10, data),
smooth: true,
lineStyle: {
normal: {
opacity: 0.5}
}
},
{
name: 'MA20',
type: 'line',
data: that.calculateMA(20, data),
smooth: true,
lineStyle: {
normal: {
opacity: 0.5}
}
},
{
name: 'MA30',
type: 'line',
data: that.calculateMA(30, data),
smooth: true,
lineStyle: {
normal: {
opacity: 0.5}
}
},
{
name: 'Volume',
type: 'bar',
xAxisIndex: 1,
yAxisIndex: 1,
data: data.volumes
}
]
}, true);
that.myChart.dispatchAction({
type: 'brush',
areas: [
{
brushType: 'lineX',
coordRange: ['2016-06-02', '2016-06-20'],
xAxisIndex: 0
}
]
});
// })
window.addEventListener('resize', function() {
that.myChart.resize();
});
},
}
})
</script>
4、父组件中引入
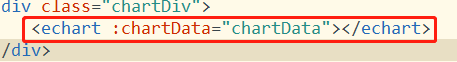
<echart :chartData="chartData"></echart>

import echart from '@/components/template/echarts'
模拟数据json==> https://echarts.baidu.com/examples/data/asset/data/stock-DJI.json
*注意:chartData中的数据开始是用的本地json模拟,用import引入,但是图表只显示一次,再次进入本页面之后数据错乱,后来排查是chartData的问题,要在data中定义,然后通过请求更新数据才可以正常显示;
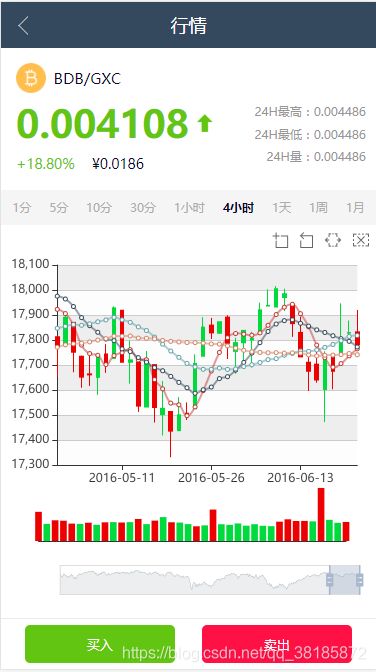
5、项目预览
##、项目中使用多语言
1、Vue-i18n安装
npm install vue-i18n --save
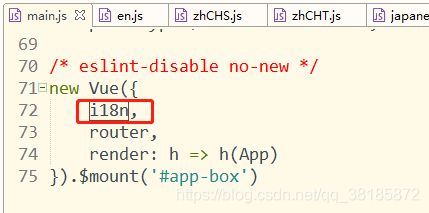
2、在main.js中配置


//使用Vue-i18n
import VueI18n from 'vue-i18n'
Vue.use(VueI18n);

const i18n = new VueI18n({

	locale: 'CHS', // 语言标识
	messages: {

		'EN': require('../static/language/en'),
		'CHS': require('../static/language/zhCHS'),
		'CHT': require('../static/language/zhCHT'),
		'KR': require('../static/language/korean'),
		'JP': require('../static/language/japanese'),
		'RU': require('../static/language/russia'),
	},
})
3、语言包配置及数据
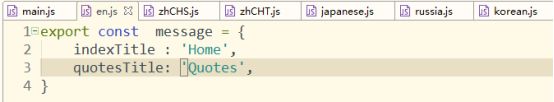
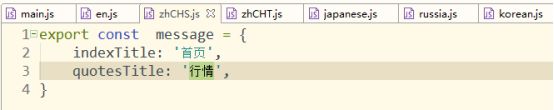
export const  message = {

    indexTitle: '首页',
    quotesTitle: '行情',
}
......
4、语言包使用
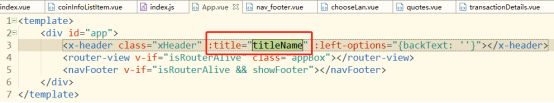

that.titleName = that.$i18n.messages[that.lanType].message[that.newRouteData.name+'Title'];
