多元统计分析及R语言建模(第五版)——第7章 聚类分析课后习题
第7章 聚类分析
文章会用到的数据请在这个网址下下载多元统计分析及R语言建模(第五版)数据
练习题
1)下面给出5个元素两两之间的距离,利用最短距离法、最长距离法和类平均法做出5个元素的谱系聚类,画谱系图并做出比较。
x1 <- c(0,4,6,1,6)
x2 <- c(4,0,9,7,3)
x3 <- c(6,9,0,10,5)
x4 <- c(1,7,10,0,8)
x5 <- c(6,3,5,8,0)
x <- rbind(x1,x2,x3,x4,x5)
y <- as.dist(x)
y
hc = hclust(y,"single")
hc
names(hc)
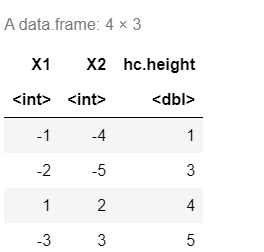
data.frame(hc $ merge,hc $ height)
plot(hc)
hc = hclust(y)
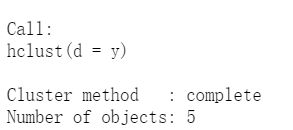
hc
names(hc)
![]()
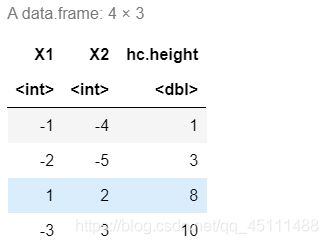
data.frame(hc $ merge,hc $ height)
plot(hc)
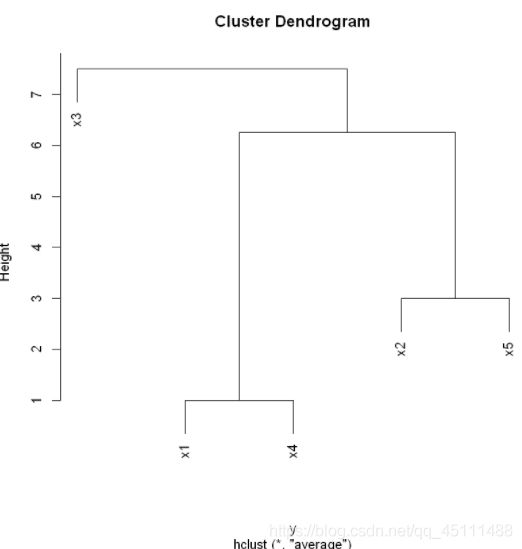
hc = hclust(y,"average")
hc
names(hc)
![]()
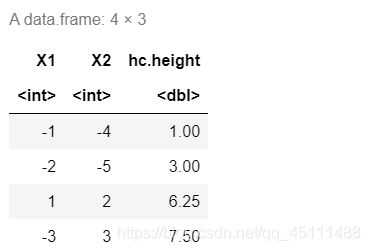
data.frame(hc $ merge,hc $ height)
plot(hc)
2)为了比较全国31个省、市、自治区1996年和2007年城镇居民生活消费的分布规律,根据调查资料做区域消费类型划分。并将1996年和2007年数据进行对比分析。今收集了8个反应城镇居民生活消费结构的指标,…
x1——人均食品支出(元/人) x2——人均衣着商品支出(元/人) x3——人均家庭设备用品及服务支出(元/人) x4——人均医疗保健支出(元/人) x5——人均交通和通信支出(元/人) x6——人均娱乐教育文化服务支出(元/人) x7——人均居住支出(元/人) x8——人均杂项商品和服务支出(元/人)
library(openxlsx)
d7.2=read.xlsx("mvexer5.xlsx",sheet = 'E7.2',rowNames = T)
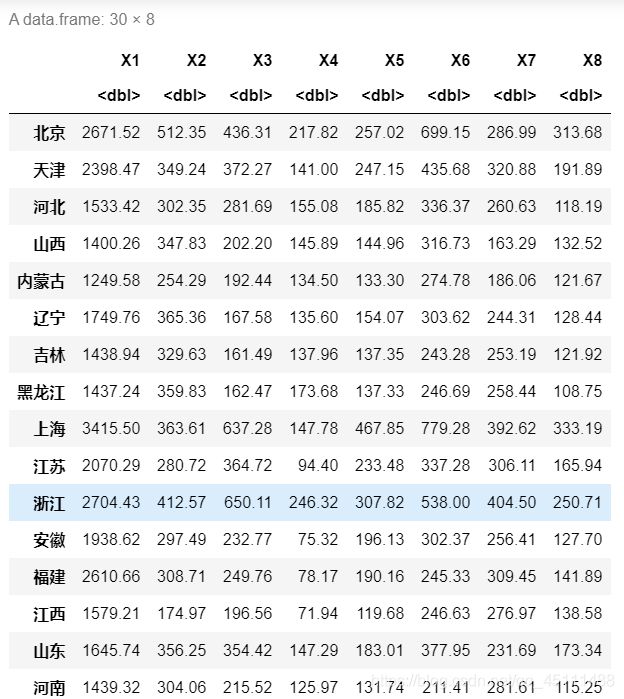
d7.2
plot(d7.2,gap=0)
D =dist(d7.2)
D
hc = hclust(D,"single")
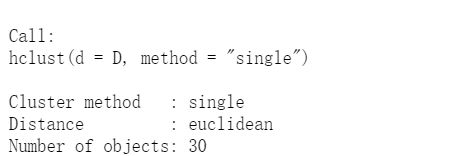
hc
names(hc)
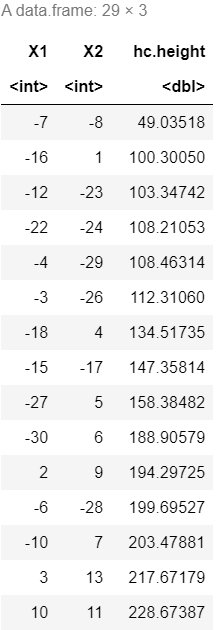
data.frame(hc $ merge,hc $ height)
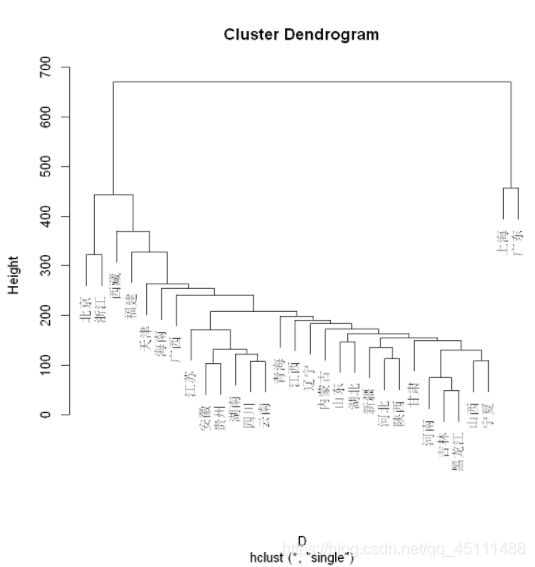
plot(hc)
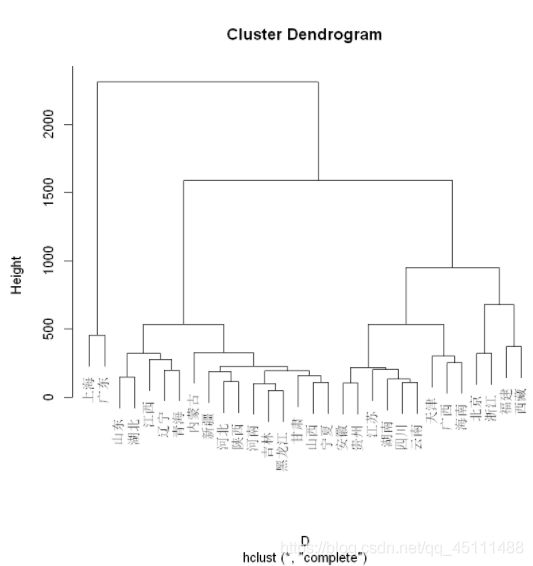
hc = hclust(D)
hc
names(hc)
data.frame(hc $ merge,hc $ height)
plot(hc)
plot(hclust(D,"median"))
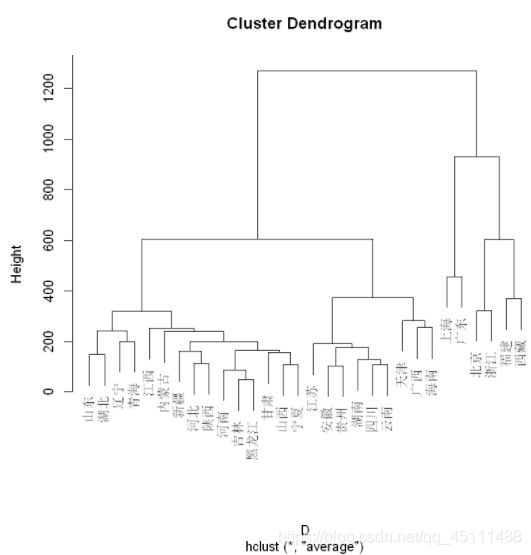
plot(hclust(D,"average"))
plot(hclust(D,"centroid"))
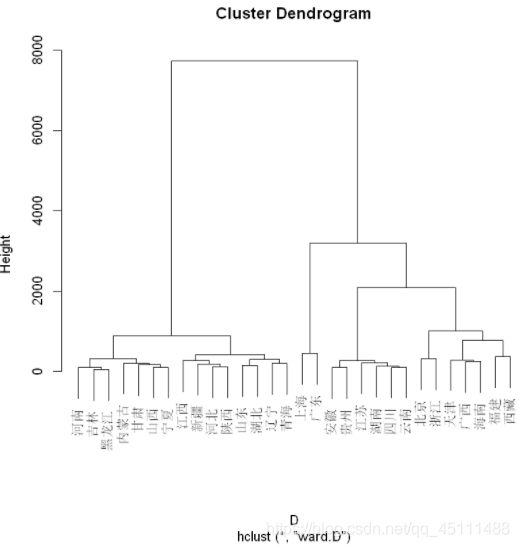
plot(hclust(D,"ward.D"))
plot(hclust(D,"ward.D2"))
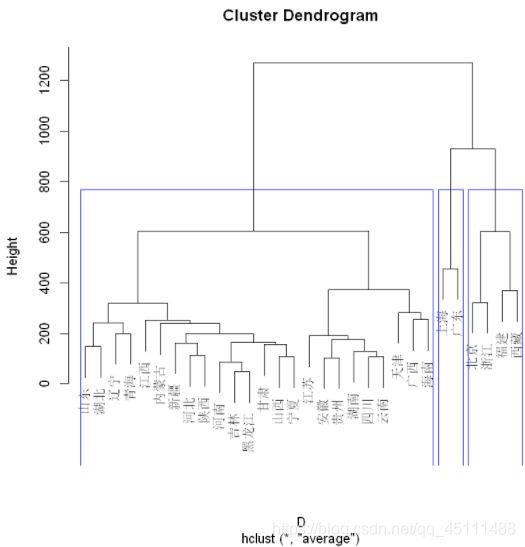
 综合考虑以上分析结果,使用类平均方法聚类效果比较好,且分为四类比较合适。
类平均法
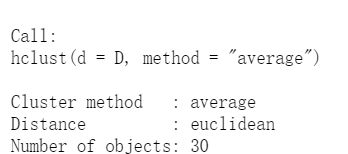
hc = hclust(D,"average")
hc
plot(hc)
rect.hclust(hc,k = 2,border = 'green')
cutree(hc,k = 2)
plot(hc)
rect.hclust(hc,k = 3,border = 'blue')
cutree(hc,k = 3)
分四类
plot(hc)
rect.hclust(hc,k = 4,border = 'pink')
cutree(hc,k = 4)

3)按例7.3模拟方法对n=20,50,100,1000,10000分别进行聚类
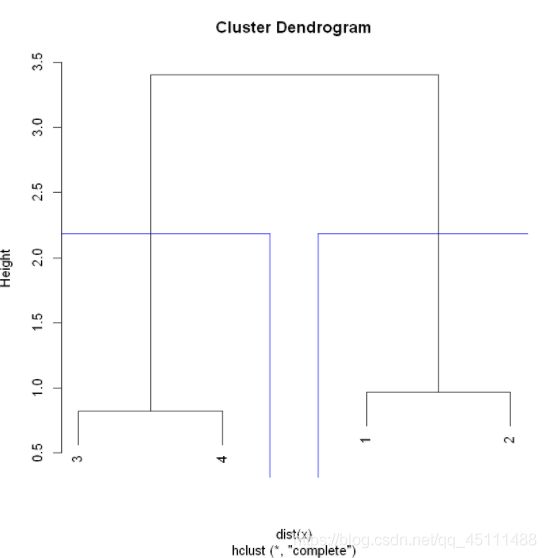
当n=20时
set.seed(1) #设定种子数
x1 = matrix(rnorm(20,0,0.25),ncol = 10) #生成矩阵1
x2 = matrix(rnorm(20,1,0.25),ncol = 10) #生成矩阵2
x = rbind(x1,x2) #按行合并
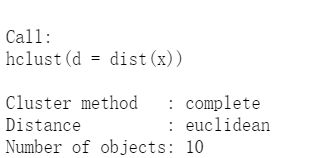
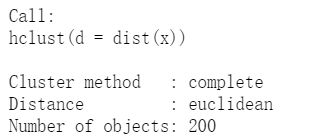
hc = hclust(dist(x))
hc
plot(hc)
rect.hclust(hc,k = 2,border = "blue")
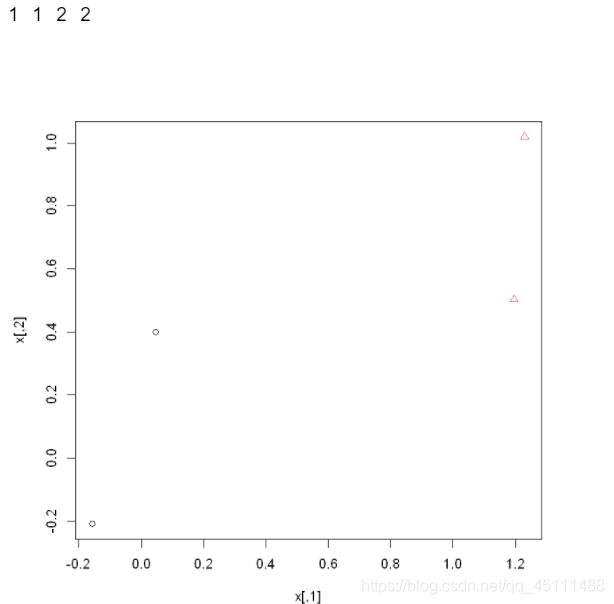
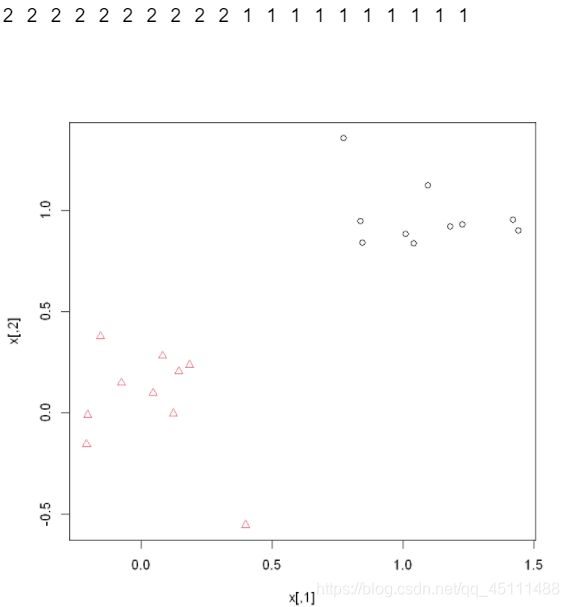
km = kmeans(x,2) #kmeans聚类
kc = km$cluster
kc #kmeans聚类结果
plot(x,pch = kc,col = kc) #画聚类结果图
set.seed(1) #设定种子数
x1 = matrix(rnorm(50,0,0.25),ncol = 10) #生成矩阵1
x2 = matrix(rnorm(50,1,0.25),ncol = 10) #生成矩阵2
x =  rbind(x1,x2) #按行合并
hc = hclust(dist(x))
hc
plot(hc)
rect.hclust(hc,k = 2,border = "blue")
km = kmeans(x,2) #kmeans聚类
kc = km$cluster
kc #kmeans聚类结果
plot(x,pch = kc,col = kc) #画聚类结果图
set.seed(1) #设定种子数
x1 = matrix(rnorm(100,0,0.25),ncol = 10) #生成矩阵1
x2 = matrix(rnorm(100,1,0.25),ncol=10) #生成矩阵2
x = rbind(x1,x2) #按行合并
hc = hclust(dist(x))
hc
plot(hc)
rect.hclust(hc,k = 2,border = "blue")
km = kmeans(x,2) #kmeans聚类
kc = km $ cluster
kc #kmeans聚类结果
plot(x,pch = kc,col = kc) #画聚类结果图
set.seed(1) #设定种子数
x1 = matrix(rnorm(1000,0,0.25),ncol = 10) #生成矩阵1
x2 = matrix(rnorm(1000,1,0.25),ncol = 10) #生成矩阵2
x = rbind(x1,x2) #按行合并
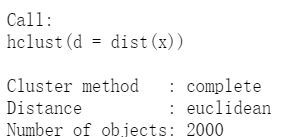
hc = hclust(dist(x))
hc
plot(hc)
rect.hclust(hc,k = 2,border = "blue")
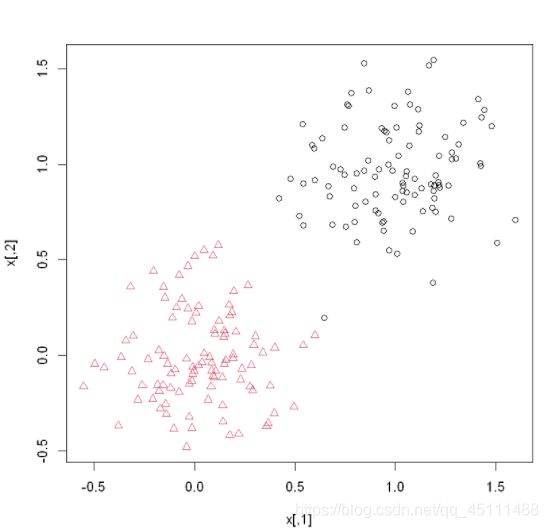
km = kmeans(x,2) #kmeans聚类
kc = km $ cluster
kc #kmeans聚类结果
plot(x,pch = kc,col = kc) #画聚类结果图
set.seed(1) #设定种子数
x1 = matrix(rnorm(10000,0,0.25),ncol = 10) #生成矩阵1
x2 = matrix(rnorm(10000,1,0.25),ncol = 10) #生成矩阵2
x = rbind(x1,x2) #按行合并
hc = hclust(dist(x))
hc
plot(hc)
rect.hclust(hc,k = 2,border = "blue")
km = kmeans(x,2) #kmeans聚类
kc = km $ cluster
kc #kmeans聚类结果
plot(x,pch=kc,col=kc) #画聚类结果图


