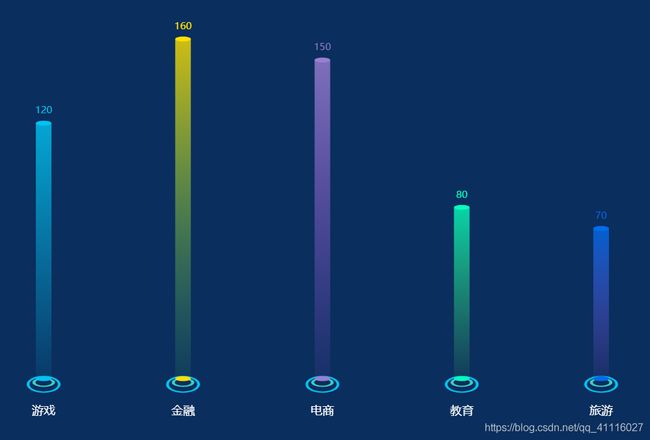
Echarts定制-立体圆柱
Echarts定制- 立体圆柱
一、基础学习
B站有超详细的基础教学视频,这里我推荐
黑马程序员pink老师[https://www.bilibili.com/video/BV1v7411R7mp]
非常的详细,风格幽默
charts社区[https://www.makeapie.com/explore.html]
这里有超多的炫酷效果
二、 立体圆柱
 let data1 = ['游戏', '金融', '电商', '教育', '旅游'];
 let data2 = [120, 160, 150, 80, 70];
 let barTopColor = ["#02c3f1", "#ffe000", "#9a7fd1", "#06fdbc", "#006ced"];
 let barBottomColor = ["rgba(2,195,241,0.1)", "rgba(83, 229, 104, 0.1)", "rgba(161, 84, 233, 0.1)", "rgba(83, 229, 104, 0.1)", "rgba(161, 84, 233, 0.1)"];
 option = {

     backgroundColor: '#0A2E5D',
     //设置网格布局,影响图形位置top bottom left right (上下左右)
     grid: {

         top: 10,
         left: 20,
         right: 10,
         bottom: 100,


     },
     xAxis: {

         data: data1,
         axisTick: {

             show: false
         },
         axisLine: {

             show: false
         },
         axisLabel: {

             show: true,
             textStyle: {

                 color: '#fff'
             },
             margin: 18
         },
     },
     yAxis: {

         type: 'value',
         splitLine: {

             show: false
         },
         axisTick: {

             show: false
         },
         axisLine: {

             show: false
         },
         axisLabel: {

             show: false
         }
     },

     series: [{

             data: data2,
             name: '柱顶部',
             type: 'pictorialBar', //指定类型
             //symbol标记类型包括 'circle', 'rect', 'roundRect', 'triangle', 'diamond','pin','arrow', 'none'
             //默认为圆形
             symbolSize: [16, 5], //指定大小,[宽,高]
             symbolOffset: [0, -3], //位置偏移 [右,下] 负数反方向
             z: 12,
             itemStyle: {

                 normal: {

                     color: function(params) {

                         return barTopColor[params.dataIndex];
                     }
                 }
             },
             label: {

                 show: true,
                 position: 'top',
                 fontSize: 10
             },
             symbolPosition: 'end'
         },
         {

             type: 'pictorialBar',
             symbolSize: [16, 5],
             symbolOffset: [0, 5],
             z: 12,
             itemStyle: {

                 normal: {

                     color: function(params) {

                         return barTopColor[params.dataIndex];
                     }
                 }
             },
             data: data2
         },
         {

             name: '第一圈',
             type: 'pictorialBar',
             symbolSize: [20, 8],
             symbolOffset: [0, 11],
             z: 11,
             itemStyle: {

                 normal: {

                     //transparent是全透明黑色(black)的速记法,即一个类似rgba(0,0,0,0)这样的值。
                     //将整个圆颜色设置为全透明黑色相当于把圆隐藏,然后只留下边框,变成一个环
                     color: 'transparent',
                     borderColor: '#3ACDC5',
                     borderWidth: 2
                 }
             },
             data: data2
         },
         {

             name: '第二圈',
             type: 'pictorialBar',
             symbolSize: [32, 16],
             symbolOffset: [0, 17],
             z: 10,
             itemStyle: {

                 normal: {

                     color: 'transparent',
                     borderColor: barTopColor[0],
                     borderWidth: 2
                 }
             },
             data: data2
         },
         {

             type: 'bar',
             itemStyle: {

                 normal: {

                     color: function(params) {

                         //使用echarts内置的渐变色生成器echarts.graphic.LinearGradient
                         // //4个参数用于配置渐变色的起止位置, 这4个参数依次对应右/下/左/上四个方位.
                         //而0 0 0 1则代表渐变色从正上方开始
                         return new echarts.graphic.LinearGradient(
                             0, 0, 0, 1,
                             //数组, 用于配置颜色的渐变过程. 每一项为一个对象,
                             //包含offset和color两个参数. offset的范围是0 ~ 1, 用于表示位置
                             [{

                                     offset: 0,
                                     color: barTopColor[params.dataIndex]
                                 },
                                 {

                                     offset: 1,
                                     color: barBottomColor[params.dataIndex]
                                 }
                             ]
                         );
                     },
                     opacity: 0.8
                 }
             },
             z: 16,
             silent: true,
             barWidth: 16,
             barGap: '-100%', // Make series be overlap
             data: data2
         }
     ]
 };
