用Matplotlib画两张花里胡哨的图
作者:小小明
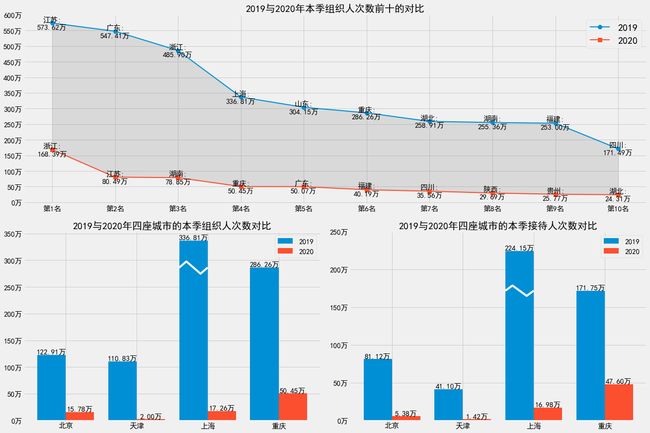
今天要画两张图,分别是:
代码逻辑较为复杂,这次只展示代码。
导包
import matplotlib.pyplot as plt
import matplotlib as mpl
import numpy as np
import pandas as pd
# 解决中文显示问题
mpl.rcParams['font.sans-serif'] = ['SimHei']
mpl.rcParams['axes.unicode_minus'] = False
数据读取
excel = pd.ExcelFile("旅游数据.xlsx")
df_2019 = pd.read_excel(excel, sheet_name=0)
df_2020 = pd.read_excel(excel, sheet_name=1)
df_2019["年份"] = 2019
df_2020["年份"] = 2020
display(df_2019.head())
df_2020['指标名称'].replace('兵团', '新疆兵团', inplace=True)
df_2020.tail()
| 指标名称 | 代码 | 本季组织人次数 | 本季接待人次数 | 本季组织人天数 | 本季接待人天数 | 年份 | |
|---|---|---|---|---|---|---|---|
| 0 | 北京 | 1 | 1229139 | 811223 | 4841564 | 3654045 | 2019 |
| 1 | 天津 | 2 | 1108300 | 411033 | 2989315 | 1057598 | 2019 |
| 2 | 河北 | 3 | 813446 | 343793 | 1991293 | 750916 | 2019 |
| 3 | 山西 | 4 | 587867 | 555379 | 2066682 | 2218679 | 2019 |
| 4 | 内蒙古 | 5 | 115648 | 186861 | 461579 | 640426 | 2019 |
| 指标名称 | 代码 | 本季组织人次数 | 本季接待人次数 | 本季组织人天数 | 本季接待人天数 | 年份 | |
|---|---|---|---|---|---|---|---|
| 27 | 甘肃 | 28 | 83076 | 27911 | 133133 | 64421 | 2020 |
| 28 | 青海 | 29 | 55968 | 33627 | 65130 | 52868 | 2020 |
| 29 | 宁夏 | 30 | 47134 | 23854 | 78404 | 35521 | 2020 |
| 30 | 新疆 | 31 | 38474 | 20079 | 74410 | 33474 | 2020 |
| 31 | 新疆兵团 | 32 | 25759 | 18005 | 49957 | 39839 | 2020 |
第一张图
plt.style.use('fivethirtyeight')
plt.figure(figsize=(20, 14))
plt.subplot(2, 1, 1)
plt.title("2019与2020年本季组织人次数前十的对比", fontsize=20)
t1 = (df_2019[["指标名称", "本季组织人次数"]]
      .sort_values("本季组织人次数", ascending=False)
      .head(10)
      )
t2 = (df_2020[["指标名称", "本季组织人次数"]]
      .sort_values("本季组织人次数", ascending=False)
      .head(10)
      )
plt.plot(range(10), t1['本季组织人次数'], linewidth=2,
         label='2019', marker='o', markersize=8)
plt.plot(range(10), t2['本季组织人次数'], linewidth=2,
         label='2020', marker='s', markersize=8)
plt.fill_between(range(10), t1['本季组织人次数'], t2['本季组织人次数'],
                 color="gray", alpha=0.2, label="area")
plt.legend(['2019', '2020'], fontsize=20)
plt.grid(b=True)
for x, (city, y) in enumerate(t1[["指标名称", "本季组织人次数"]].values):
    plt.text(x, y, f"{city}:\n{y/10000:.2f}万", fontsize=15,
             horizontalalignment='center', verticalalignment='center')
for x, (city, y) in enumerate(t2[["指标名称", "本季组织人次数"]].values):
    plt.text(x, y, f"{city}:\n{y/10000:.2f}万", fontsize=15,
             horizontalalignment='center', verticalalignment='center')
plt.xticks(range(10), [f"第{i}名" for i in range(1, 11)], fontsize=15)
plt.yticks(range(0, 6500000, 500000), [
           f"{i//10000}万" for i in range(0, 6500000, 500000)], fontsize=15)

plt.subplot(2, 2, 3)
plt.title("2019与2020年四座城市的本季组织人次数对比", fontsize=20)
t1 = df_2019.loc[df_2019["指标名称"].isin(["北京", "天津", "上海", "重庆"]), [
    "指标名称", "本季组织人次数"]]
t2 = df_2020.loc[df_2020["指标名称"].isin(["北京", "天津", "上海", "重庆"]), [
    "指标名称", "本季组织人次数"]]
index = np.arange(4)
plt.bar(index, t1['本季组织人次数'], width=0.4, label='2019')
plt.bar(index+0.4, t2['本季组织人次数'], width=0.4, label='2020')
cutoff_postion = t1["本季组织人次数"].reset_index(
    drop=True).sort_values(ascending=False).index[:2]
x, y = cutoff_postion[0], t1["本季组织人次数"].iat[cutoff_postion[1]]
plt.plot(np.array([-0.2, -0.1, 0.1, 0.2])+x,
         np.array([0, 1, -1, 0])*y*0.04+y, color="white")

plt.legend(fontsize=15)
plt.grid(b=True, axis='y')
plt.xticks(index+0.2, t1['指标名称'], fontsize=15)
plt.yticks(range(0, 4000000, 500000), [
           f"{i//10000}万" for i in range(0, 4000000, 500000)], fontsize=15)
for x, (y1, y2) in enumerate(zip(t1["本季组织人次数"], t2["本季组织人次数"])):
    plt.text(x, y1, f"{y1/10000:.2f}万", verticalalignment='bottom',
             horizontalalignment='center', fontsize=15)
    plt.text(x+0.4, y2, f"{y2/10000:.2f}万", verticalalignment='bottom',
             horizontalalignment='center', fontsize=15)

plt.subplot(2, 2, 4)
plt.title("2019与2020年四座城市的本季接待人次数对比", fontsize=20)
t1 = df_2019.loc[df_2019["指标名称"].isin(["北京", "天津", "上海", "重庆"]), [
    "指标名称", "本季接待人次数"]]
t2 = df_2020.loc[df_2020["指标名称"].isin(["北京", "天津", "上海", "重庆"]), [
    "指标名称", "本季接待人次数"]]
index = np.arange(4)
plt.bar(index, t1['本季接待人次数'], width=0.4, label='2019')
plt.bar(index+0.4, t2['本季接待人次数'], width=0.4, label='2020')
cutoff_postion = t1["本季接待人次数"].reset_index(
    drop=True).sort_values(ascending=False).index[:2]
x, y = cutoff_postion[0], t1["本季接待人次数"].iat[cutoff_postion[1]]
plt.plot(np.array([-0.2, -0.1, 0.1, 0.2])+x,
         np.array([0, 1, -1, 0])*y*0.04+y, color="white")

plt.legend(fontsize=15)
plt.grid(b=True, axis='y')
plt.xticks(index+0.2, t1['指标名称'], fontsize=15)
plt.yticks(range(0, 3000000, 500000), [
           f"{i//10000}万" for i in range(0, 3000000, 500000)], fontsize=15)
for x, (y1, y2) in enumerate(zip(t1["本季接待人次数"], t2["本季接待人次数"])):
    plt.text(x, y1, f"{y1/10000:.2f}万", verticalalignment='bottom',
             horizontalalignment='center', fontsize=15)
    plt.text(x+0.4, y2, f"{y2/10000:.2f}万", verticalalignment='bottom',
             horizontalalignment='center', fontsize=15)
plt.subplots_adjust(wspace=0.1, hspace=0.15)
plt.show()
第二张图
plt.style.use('fivethirtyeight')
plt.figure(figsize=(20, 20))
plt.subplot(3, 2, 1)
df_tmp = pd.concat([df_2019, df_2020]).groupby("年份").sum().drop(columns="代码").T
plt.title("四项指标总和年度对比", fontsize=15)
index = np.arange(4)
plt.bar(index, df_tmp[2019], width=0.4, label='2019')
plt.bar(index+0.4, df_tmp[2020], width=0.4, label='2020')
plt.plot(index+0.4, df_tmp[2020], linewidth=2, color='orange')
plt.legend(title="年份")
plt.grid(b=True)
for x, (y1, y2) in enumerate(df_tmp.values):
    plt.text(x, y1, f"{y1/1e4:.1f}万", verticalalignment='bottom',
             horizontalalignment='center')
    plt.text(x+0.4, y2, f"{y2/1e4:.1f}万", verticalalignment='bottom',
             horizontalalignment='center')
plt.xticks(index+0.2, df_tmp.index)
plt.yticks(np.arange(0, 1.4e8, 1e7), [
           f"{i//1e4:.0f}万" for i in np.arange(0, 1.4e8, 1e7)], fontsize=15)

plt.subplot(3, 2, 2)
plt.title("中部地带本季组织人次数年度对比", fontsize=15)
df_tmp = pd.concat([df_2019[["指标名称", "本季组织人次数"]].set_index("指标名称"),
                    df_2020[["指标名称", "本季组织人次数"]].set_index("指标名称")], axis=1)
df_tmp.columns = [2019, 2020]
df_tmp = df_tmp.loc[["黑龙江", "吉林", "山西", "内蒙古", "安徽", "河南", "湖北", "湖南", "江西"]]
plt.barh(df_tmp.index, df_tmp[2019], label='2019')
plt.barh(df_tmp.index, -df_tmp[2020], label='2020')
plt.legend(title="年份", loc='lower right')
plt.grid(b=True)
plt.xticks(np.arange(-1e6, 2.7e6, 4e5), [
           f"{abs(i)//1e4:.0f}万" for i in np.arange(-1e6, 2.7e6, 4e5)], fontsize=15)
for y, (x1, x2) in enumerate(df_tmp.values):
    plt.text(x1, y, f"{x1/1e4:.1f}万", verticalalignment='center',
             horizontalalignment='left')
    plt.text(-x2, y, f"{x2/1e4:.1f}万", verticalalignment='center',
             horizontalalignment='right')
plt.xlim([-1.1e6, 2.7e6])

plt.subplot(3, 2, 3)
df_tmp = pd.concat([df_2019[["指标名称", "本季接待人次数"]].set_index("指标名称"),
                    df_2020[["指标名称", "本季接待人次数"]].set_index("指标名称")], axis=1)
df_tmp.columns = [2019, 2020]
df_tmp.columns.name = "年份"
df_tmp = df_tmp.loc[["辽宁", "河北", "天津", "北京", "山东",
                     "江苏", "上海", "浙江", "福建", "广东", "广西", "海南"]]
s = df_tmp[2019]/10000
radius_s = ((s-s.min())/(s.max()-s.min())+0.8).values
wedges, texts1, texts2 = plt.pie(
    s,  # 数据
    explode=[0.1]*df_tmp.shape[0],  # 指定每部分的偏移量
    labels=df_tmp.index,  # 标签
    autopct="%.2f万",  # 饼图上的数据标签显示方式
    pctdistance=0.6,  # 每个饼切片的中心和通过autopct生成的文本开始之间的比例
    labeldistance=1,  # 被画饼标记的直径,默认值:1.1
    shadow=True,  # 阴影
    startangle=0,  # 开始角度
    radius=1.8,  # 半径
    frame=False,  # 图框
    counterclock=True,  # 指定指针方向,顺时针或者逆时针
)
for i, wedge in enumerate(wedges):
    wedge.set_radius(radius_s[i])
for i, text in enumerate(texts1):
    text.set_position(
        tuple(map(lambda x: x*radius_s[i]/1.7, text.get_position())))
for i, text in enumerate(texts2):
    if radius_s[i] < 0.9:
        text.set_text("")
        continue
    text.set_position(
        tuple(map(lambda x: x*radius_s[i]/2, text.get_position())))

plt.subplot(3, 2, 4)
# plt.title("2020年东部沿海地带本季接待人次数", fontsize=15)
s = df_tmp[2020]/10000
radius_s = ((s-s.min())/(s.max()-s.min())+0.8).values
wedges, texts1, texts2 = plt.pie(
    s,  # 数据
    explode=[0.1]*df_tmp.shape[0],  # 指定每部分的偏移量
    labels=df_tmp.index,  # 标签
    autopct="%.2f万",  # 饼图上的数据标签显示方式
    pctdistance=0.6,  # 每个饼切片的中心和通过autopct生成的文本开始之间的比例
    labeldistance=1,  # 被画饼标记的直径,默认值:1.1
    shadow=True,  # 阴影
    startangle=0,  # 开始角度
    radius=1.8,  # 半径
    frame=False,  # 图框
    counterclock=True,  # 指定指针方向,顺时针或者逆时针
)
for i, wedge in enumerate(wedges):
    wedge.set_radius(radius_s[i])
for i, text in enumerate(texts1):
    if radius_s[i] < 0.83:
        text.set_text("")
        continue
    text.set_position(
        tuple(map(lambda x: x*radius_s[i]/1.7, text.get_position())))
for i, text in enumerate(texts2):
    if radius_s[i] < 0.87:
        text.set_text("")
        continue
    text.set_position(
        tuple(map(lambda x: x*radius_s[i]/2, text.get_position())))


plt.subplot(3, 1, 3)
plt.title("西部地带本季接待人天数气泡图", fontsize=15)
df_tmp = pd.concat([df_2019[["指标名称", "本季接待人天数"]].set_index("指标名称"),
                    df_2020[["指标名称", "本季接待人天数"]].set_index("指标名称")], axis=1)
df_tmp.columns = [2019, 2020]
df_tmp.columns.name = "年份"
df_tmp = df_tmp.loc[["陕西", "甘肃", "宁夏", "青海",
                     "新疆", "重庆", "四川", "云南", "贵州", "西藏"]]
index = range(df_tmp.shape[0])
plt.scatter(
    index,
    [2]*df_tmp.shape[0],  # 按照经纬度显示
    s=df_tmp[2019] / 1000,  # 按照单价显示大小
    c=range(df_tmp.shape[0]),  # 按照总价显示颜色
    alpha=0.6,
    cmap="jet",
)
plt.scatter(
    index,
    [1]*df_tmp.shape[0],  # 按照经纬度显示
    s=df_tmp[2020] / 1000,  # 按照单价显示大小
    c=range(df_tmp.shape[0]),  # 按照总价显示颜色
    alpha=0.6,
    cmap="jet",
)
for i, (v1, v2) in enumerate(df_tmp.values):
    plt.text(i, 2, f"{v1/10000:.0f}万", verticalalignment='center',
             horizontalalignment='center', fontsize=15)
    plt.text(i, 1, f"{v2/10000:.0f}万", verticalalignment='bottom',
             horizontalalignment='center', fontsize=15)
plt.xticks(index, df_tmp.index)
plt.yticks([1, 2], [2020, 2019])
plt.ylim([0.5, 2.5])

plt.subplots_adjust(wspace=0.1, hspace=0.4)
plt.show()

