【Task02】前沿学术数据分析AcademicTrends
一、查看数据
2020版数据集下载地址:
https://www.kaggle.com/Cornell-University/arxiv
上次由于时间仓促直接使用了2019版的数据集,这次下了2020完整版的json文件,一共2.69G,让我们剖析一下数据:
import pandas as pd
import json

data = []
with open("./data/arxiv-metadata-oai-snapshot.json", 'r') as f:
    for idx, line in enumerate(f):
        d = json.loads(line)
        d = {
     'authors': d['authors'], 'categories': d['categories'], 'authors_parsed': d['authors_parsed']}
        data.append(d)
data = pd.DataFrame(data)
data.head(10)
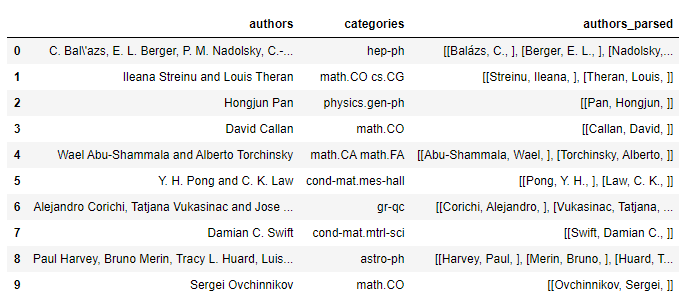
这里只取了2个属性进行分析,分别是每篇论文的作者authors和论文类别categories,另外authors_parsed字段已经帮我们处理好了作者信息,在之后可以直接使用它。
再查看一下整个数据集中论文的数量:
data.shape
(1796911, 3)
可以看到相当于2019年之前的10倍,比摩尔定律增长还快。
二、数据处理步骤
以authors为例,探究如何将其变为authors_parsed类似格式:
import re
def processStr(x):
    def splitName(fullname):
        names = fullname.split(' ')
        return [names[-1],''.join(names[:-1]),'']
    x = x.replace('\\','').replace(' and ',',')
    strList = re.split(',',x)
    res = [splitName(x) for x in strList]
    return res
data.head().authors.apply(processStr)
0    [[Bal'azs, C., ], [Berger, E.L., ], [Nadolsky,...
1             [[Streinu, Ileana, ], [Theran, Louis, ]]
2                                   [[Pan, Hongjun, ]]
3                                  [[Callan, David, ]]
4    [[Abu-Shammala, Wael, ], [Torchinsky, Alberto, ]]
Name: authors, dtype: object
我们来测试一下是否与authors_parsed保持一致:
data.head().authors.apply(processStr) == data.head().authors_parsed
0    False
1     True
2     True
3     True
4     True
dtype: bool
可以看到前五行除了第一篇作者名字中的á没有成功转换,其他都保持一致。
在后面我们直接使用authors_parsed列代替authors列进行使用。
三、数据统计
为了节省时间,直接指定cs.CV方向的论文:
data2 = data[data.categories.str.contains('cs.CV')]
data2

先讨论一下sum中的start参数用法:
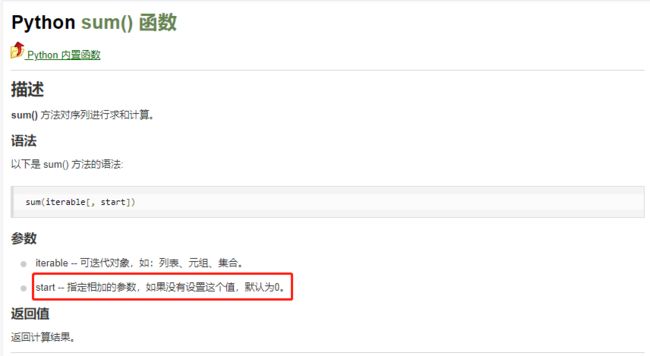
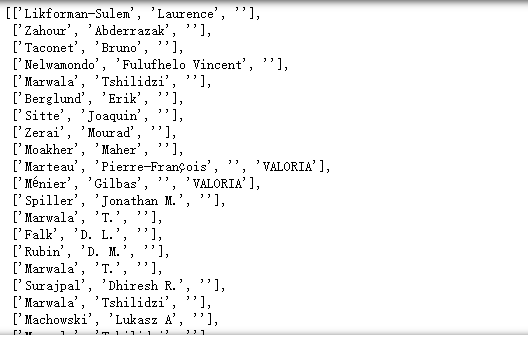
指定start参数为’[]'即表明sum是以列表为最小单位:
sum(data2['authors_parsed'].head(),[])
[['Likforman-Sulem', 'Laurence', ''],
 ['Zahour', 'Abderrazak', ''],
 ['Taconet', 'Bruno', ''],
 ['Nelwamondo', 'Fulufhelo Vincent', ''],
 ['Marwala', 'Tshilidzi', ''],
 ['Berglund', 'Erik', ''],
 ['Sitte', 'Joaquin', ''],
 ['Zerai', 'Mourad', ''],
 ['Moakher', 'Maher', ''],
 ['Marteau', 'Pierre-François', '', 'VALORIA'],
 ['Ménier', 'Gilbas', '', 'VALORIA']]
将所有论文作者的姓名存入List中:
all_authors = sum(data2['authors_parsed'], [])
all_authors
查看all_authors长度:
len(all_authors)
205345
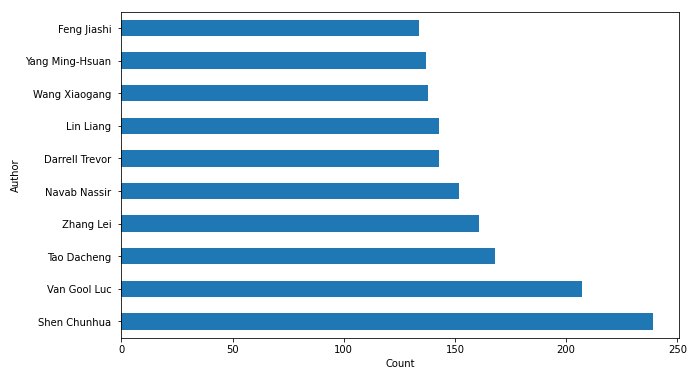
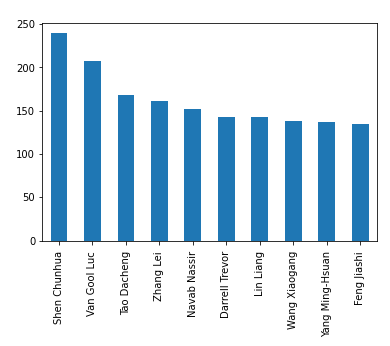
1.统计所有作者姓名出现频率的Top10
将个人姓名压缩到一个字符串中:
[' '.join(x) for x in a]
['Likforman-Sulem Laurence ',
 'Zahour Abderrazak ',
 'Taconet Bruno ',
 'Nelwamondo Fulufhelo Vincent ',
 'Marwala Tshilidzi ']
import matplotlib.pyplot as plt
authors_names = [' '.join(x) for x in all_authors]
authors_names = pd.DataFrame(authors_names)

# 根据作者频率绘制直方图
plt.figure(figsize=(10, 6))
authors_names[0].value_counts().head(10).plot(kind='barh')
plt.ylabel('Author')
plt.xlabel('Count')
names = authors_names[0].value_counts().index.values[:10]
_ = plt.yticks(range(0, len(names)), names)
垂直排列:
authors_names[0].value_counts().head(10).plot(kind='bar')
2.统计所有作者姓(姓名最后一个单词)的出现频率的Top10
authors_lastnames = [x[0] for x in all_authors]
authors_lastnames = pd.DataFrame(authors_lastnames)

plt.figure(figsize=(10, 6))
authors_lastnames[0].value_counts().head(10).plot(kind='barh')

names = authors_lastnames[0].value_counts().index.values[:10]
_ = plt.yticks(range(0, len(names)), names)
plt.ylabel('Author')
plt.xlabel('Count')

只需把‘ ’.join(x)改为x[0]即可。
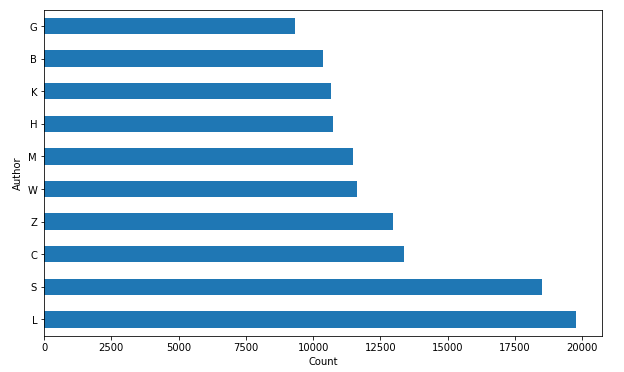
3.统计所有作者姓第一个字符的评率
同上,只需将列表推导生成式中的循环变量改为x[0][0]即可:
authors_lastnames_firstlabel = [x[0][0] for x in all_authors]
authors_lastnames_firstlabel = pd.DataFrame(authors_lastnames_firstlabel)

plt.figure(figsize=(10, 6))
authors_lastnames_firstlabel[0].value_counts().head(10).plot(kind='barh')

names = authors_lastnames_firstlabel[0].value_counts().index.values[:10]
_ = plt.yticks(range(0, len(names)), names)
plt.ylabel('Author')
plt.xlabel('Count')
参考文献
1.Python sum() 函数
https://www.runoob.com/python/python-func-sum.html