python 图像处理 角点检测算法 Harris和Shi-tomasi
一.使用opencv库调用实现编写Harris和Shi-tomasi算法
最主要函数为:
cv2.cornerHarris()
cv2.goodFeaturesToTrack()
代码中注释有介绍其用法。
# 角点检测算法
# 使用Harris检测算法和shi_tomasi检测算法,并对比他们的效果
# 使用opencv实现
import numpy as np
import matplotlib.image as imgplt
import cv2
import matplotlib.pyplot as plt
'''
Function : cv2.cornerHarris(image,blocksize,ksize,k)
Parameters are as follows :
1. image : the source image in which we wish to find the corners (grayscale)
2. blocksize : size of the neighborhood in which we compare the gradient
3. ksize : aperture parameter for the Sobel() Operator (used for finding Ix & Iy)
4. k : Harris detector free parameter (used in computing R)
'''
def harris_corners(im):
image = im
gray_img = cv2.cvtColor(image, cv2.COLOR_BGR2GRAY)
float_img = np.float32(gray_img)
corners_img = cv2.cornerHarris(float_img, 3, 3, 0.04)
corners_img = cv2.dilate(corners_img, None)
# image[corners_img > 0.01 * corners_img.max()] = [0, 0, 255]
max_corner = 0.01 * np.max(corners_img)
for i in range(corners_img.shape[0]):
for j in range(corners_img.shape[1]):
px = corners_img[i, j]
if px >= max_corner:
image[i, j] = [0, 0, 255]
return corners_img, image
'''
Function: cv2.goodFeaturesToTrack(image,maxCorners, qualityLevel, minDistance[, corners[, mask[, blockSize[, useHarrisDetector[, k]]]]])
image – Input 8-bit or floating-point 32-bit (grayscale image).
maxCorners – You can specify the maximum no. of corners to be detected. (Strongest ones are returned if detected more than max.)
qualityLevel – Minimum accepted quality of image corners.
minDistance – Minimum possible Euclidean distance between the returned corners.
corners – Output vector of detected corners.
mask – Optional region of interest.
blockSize – Size of an average block for computing a derivative covariation matrix over each pixel neighborhood.
useHarrisDetector – Set this to True if you want to use Harris Detector with this function.
k – Free parameter of the Harris detector (used in computing R)
'''
def shi_tomasi(im):
gray_img = cv2.cvtColor(im, cv2.COLOR_BGR2GRAY)
# You can play with these parameters to get different outputs
corners_img = cv2.goodFeaturesToTrack(gray_img, 1200, 0.01, 10)
# corners_img = np.int0(corners_img)
blank_img = np.zeros((im.shape[0], im.shape[1], 3), np.uint8)
for corners in corners_img:
x, y = corners.ravel()
cv2.circle(im, (x, y), 3, [255, 0, 0], -1)
cv2.circle(blank_img, (x, y), 2, [255, 0, 0], -1)
return im, blank_img
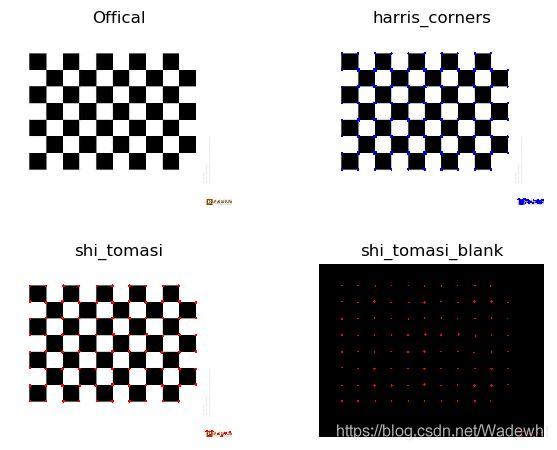
if __name__ == '__main__':
img1 = cv2.imread('corner.jpg')
img2 = cv2.imread('corner.jpg')
plt.subplot(2, 2, 1)
plt.imshow(img1)
plt.axis('off')
plt.title('Offical')
h_image, h_image1 = harris_corners(img1)
plt.subplot(2, 2, 2)
plt.imshow(h_image1)
plt.axis('off')
plt.title('harris_corners')
shi_image, shi_blank = shi_tomasi(img2)
plt.subplot(2, 2, 3)
plt.imshow(shi_image)
plt.axis('off')
plt.title('shi_tomasi')
plt.subplot(2, 2, 4)
plt.imshow(shi_blank)
plt.axis('off')
plt.title('shi_tomasi_blank')
plt.show()
结果展示:
二.自编写实现Harris算法
效果较差,仅供参考。
# 角点检测
# Harris角点检测算法
# 自编写,效果一般

from math import exp
from scipy import signal
from PIL import Image
from pylab import *
import numpy


# Main function
def main():
    # The image is opened and converted to grayscale.
    im1 = array(Image.open('corner.jpg').convert("L"))
    # Function is computed  using 3 responses
    harrisim1_R1, harrisim1_R2, harrisim1_R3 = compute_harris_response(im1)
    # points selected based on the response values1
    filtered_coords1_R1 = get_harris_points(harrisim1_R1, 10, 0.1)
    # points selected based on the response values2
    filtered_coords1_R2 = get_harris_points(harrisim1_R2, 10, 0.1)
    # points selected based on the response values3
    filtered_coords1_R3 = get_harris_points(harrisim1_R3, 10, 0.1)
    # The points are plotted overlaid on the original image.
    plot_harris_points(im1, filtered_coords1_R1)
    # The points are plotted overlaid on the original image.
    plot_harris_points(im1, filtered_coords1_R2)
    # The points are plotted overlaid on the original image.
    plot_harris_points(im1, filtered_coords1_R3)


# returns x and y derivatives of a 2D gauss kernel array for convolutions
def gauss_derivative_kernels(size, sizey=None):
      # array sizex from parameter
      size = int(size)
      # array sizey
      if not sizey:
          # array sizey assigned to sizex if not declared
          sizey = size
      else:
          # array sizey from parameter
          sizey = int(sizey)
      # numpy array creation from minus sizex and sizey to sizex + 1 to sizey + 1
      y, x = mgrid[-size:size+1, -sizey:sizey+1]

      # apply 2d gaussian formula to newly created array for array x
      gx = - x * exp(-(x**2/float((0.5*size)**2)+y**2/float((0.5*sizey)**2)))
      # apply 2d gaussian formula to newly created array for array y
      gy = - y * exp(-(x**2/float((0.5*size)**2)+y**2/float((0.5*sizey)**2)))

      return gx, gy


# returns x and y derivatives of an image using gaussian derivative filters of size n. The optional argument
# ny allows for a different size in the y direction.
def gauss_derivatives(im, n, ny=None):

    gx, gy = gauss_derivative_kernels(n, sizey=ny)

    # Convolving : Mathematical operation on two functions that produce a third function that describes how one's function is changed by the other.
    # convolving derivative gauss kernel gx with image
    imx = signal.convolve(im, gx, mode='same')
    # convolving derivative gauss kernel gy with image
    imy = signal.convolve(im, gy, mode='same')

    return imx, imy


# This gives an image with each pixel containing the value of the Harris response function.
# compute the Harris corner detector response function for each pixel in the image
def compute_harris_response(image):

    # convolving image with gaussian
    imx, imy = gauss_derivatives(image, 3)

    # kernel for blurring
    gauss = gauss_kernel(3)

    # matrix W is created from the outer product of the image gradient
    Wxx = signal.convolve(imx*imx, gauss, mode='same')
    Wxy = signal.convolve(imx*imy, gauss, mode='same')
    Wyy = signal.convolve(imy*imy, gauss, mode='same')

    # getting determinant and trace
    # determinant
    Wdet = Wxx*Wyy - Wxy**2
    # trace
    Wtr = Wxx + Wyy
    # this matrix is averaged over a region and then a corner response function is defined as the ratio of the determinant to the trace of W.
    # “Corner” λ1 and λ2 are large, λ1 ~ λ2; E increases in all directions
    R1 = Wdet / Wtr
    # get eigen values
    l1, l2 = get_eigvals(Wxx, Wxy, Wyy)
    R2 = numpy.minimum(Wxx, Wyy) #(Shi-Tomasi score)
    # k is an emprical value between 0.04-0.06.
    k = 0.06
    R3 = Wdet - (k * (Wtr**2))  # one of the corner response measure according to lecture
    R2 = numpy.minimum(l1, l2)  # (Shi-Tomasi score)
    # k is an emprical value between 0.04-0.06.
    k = 0.06
    R3 = Wdet - (k * (Wtr**2))  # one of the corner response measure according to lecture

    return R1, R2, R3


# finding eigen values of convolution
def get_eigvals(M00, M01, M11):
    l1 = (M00 + M11) / 2 + np.sqrt(4 * M01 ** 2 + (M00 - M11) ** 2) / 2
    l2 = (M00 + M11) / 2 - np.sqrt(4 * M01 ** 2 + (M00 - M11) ** 2) / 2
    return l1, l2


# This gives an image with each pixel containing the value of the Harris response function.
def get_harris_points(harrisim, min_distance=10, threshold=0.03):
    """ return corners from a Harris response image
        min_distance is the minimum nbr of pixels separating
        corners and image boundary"""

    # find top corner candidates above a threshold
    corner_threshold = max(harrisim.ravel()) * threshold
    harrisim_t = (harrisim > corner_threshold) * 1

    # get coordinates of candidates
    candidates = harrisim_t.nonzero()
    coords = [ (candidates[0][c],candidates[1][c]) for c in range(len(candidates[0]))]
    candidate_values = [harrisim[c[0]][c[1]] for c in coords]

    # sort candidates
    # sort them in descending order of corner response values
    index = argsort(candidate_values)

    # store allowed point locations in array
    allowed_locations = zeros(harrisim.shape)
    allowed_locations[min_distance:-min_distance, min_distance:-min_distance] = 1

    # select the best points taking min_distance into account
    # mark off regions too close to positions already marked as corners.
    filtered_coords1 = []
    filtered_coords = []
    choosedvals = []
    # iterate through candidates
    for i in index:
        if allowed_locations[coords[i][0]][coords[i][1]] == 1:
            # choose as corner
            filtered_coords1.append(coords[i])
            # take choosed val for top 10 below
            choosedvals.append(candidate_values[i])
            # unmark too close locations to selected coords (min_distance)
            allowed_locations[(coords[i][0] - min_distance):(coords[i][0] + min_distance),
            (coords[i][1] - min_distance):(coords[i][1] + min_distance)] = 0

    # Lets take n = 10 top 10 corner
    n = 10
    # sort descending highest response values
    index = argsort(choosedvals)[::-1][:n]

    for i in index:
        filtered_coords.append(filtered_coords1[i])
    # select top 10
    return filtered_coords


# plots corners found in image
def plot_harris_points(image, filtered_coords):
    figure()
    # converted to grayscale
    gray()
    # the window showing output image with corners
    imshow(image)
    plot([p[1] for p in filtered_coords], [p[0] for p in filtered_coords], '*')
    axis('off')
    show()


# Returns a normalized 2D gauss kernel array for convolutions
def gauss_kernel(size, sizey = None):
    # array sizex from parameter
    size = int(size)
    # array sizey
    if not sizey:
        # array sizey equals size if not declared
        sizey = size
    else:
        # array sizey from parameter
        sizey = int(sizey)
    # numpy array creation taking from minus size and sizey to size + 1 to sizey + 1
    x, y = mgrid[-size:size+1, -sizey:sizey+1]
    # apply gauss blurring
    g = exp(-(x**2/float(size)+y**2/float(sizey)))
    return g / g.sum()


# Main function is called
if __name__ == '__main__':
    # Main function is called
    main()
结果展示: