Seaborn 学习笔记(1.0)
seaborn中使用relplot绘制散点图和线图
附上官网链接http://seaborn.pydata.org/tutorial/relational.html#relating-variables-with-scatter-plots
import seaborn as sns
from matplotlib import pyplot as plt
tips = sns.load_dataset('tips')
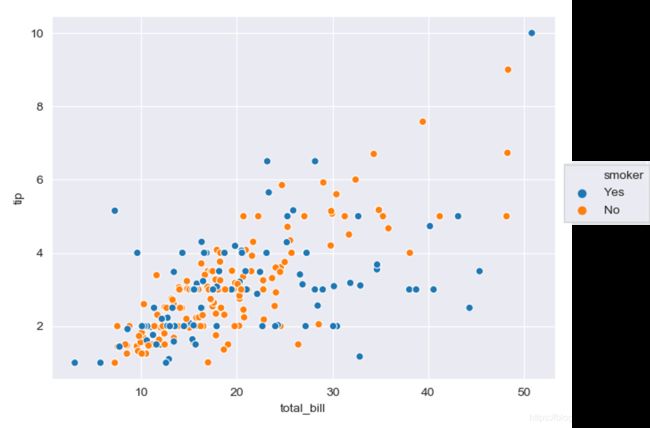
sns.relplot(x='total_bill', y='tip', hue='smoker', data=tips)
plt.show()
报错,提示 AttributeError: module 'seaborn' has no attribute 'relplot'
看到no attribute就怀疑是版本问题,参考的官网例程使用的是0.9.0版本,再查看一下自己的版本
import seaborn as sns
print(sns.__version__)
>>0.8.1
果然不对,升级一下seaborn版本
pip install --upgrade seaborn==0.9.0
再次运行程序,OK,成功运行
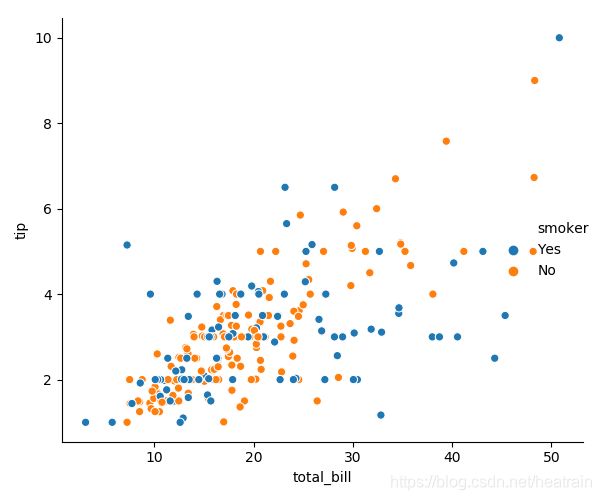
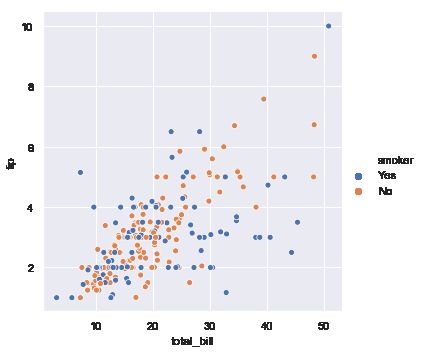
对比一下与官网给出的结果(左图为自己运行出来的结果,右图为官网给的结果)
发现有两点不一样:一是画布风格,另一个是legend位置
修改画布风格
seaborn中共有5种风格
1.darkgrid(灰色网格)
2.whitegrid(白色网格)
3.dark(黑色)
4.white(白色)
5.ticks(十字叉)
import seaborn as sns
from matplotlib import pyplot as plt

tips = sns.load_dataset('tips')
sns.set_style('darkgrid')
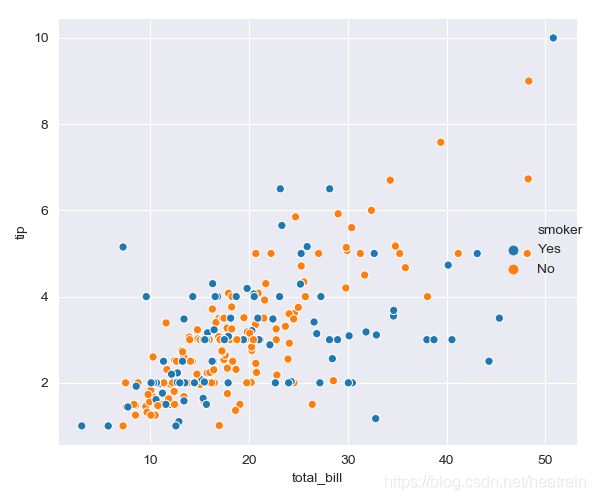
ax = sns.relplot(x='total_bill', y='tip', hue='smoker', data=tips, kind='scatter')
plt.show()
画布风格修改成功。
再改一下legend
由于relplot没有设置legend的函数,所以只好用scatterplot代替
import seaborn as sns
from matplotlib import pyplot as plt

tips = sns.load_dataset('tips')
sns.set_style('darkgrid')
ax = sns.scatterplot(x='total_bill', y='tip', hue='smoker', style="smoker",data=tips)
ax.legend(shadow=False, fancybox=False, ncol=1, fontsize=10, loc='upper left')
plt.show()
ax.legend()中
loc为位置参数
loc : int or string or pair of floats, default: 'upper right'
The location of the legend. Possible codes are:
=============== =============
Location String Location Code
=============== =============
'best' 0
'upper right' 1
'upper left' 2
'lower left' 3
'lower right' 4
'right' 5
'center left' 6
'center right' 7
'lower center' 8
'upper center' 9
'center' 10
=============== =============
大小参数fontsize
fontsize : int or float or {'xx-small', 'x-small', 'small', 'medium', 'large', 'x-large', 'xx-large'}或者具体数字
运行结果:
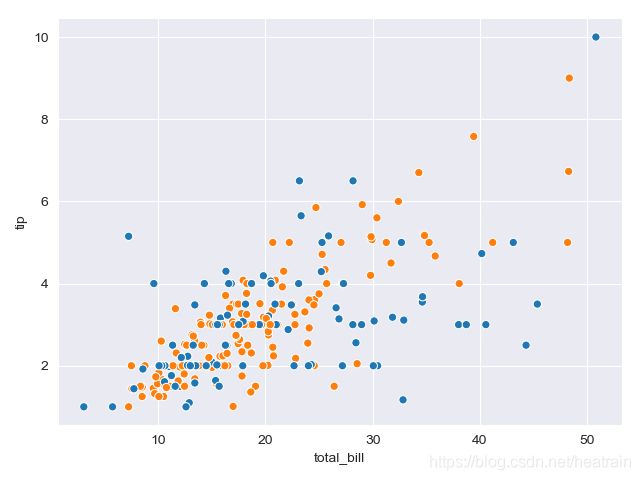
发现还是不能把legend剥离出来,暂时没有想到什么好办法,只能先调整legend位置不让它和数据重叠,再截图出来 ,然后再画一个没有legend的图,二者组合起来。
画一个没有legend的图:
import seaborn as sns
from matplotlib import pyplot as plt

tips = sns.load_dataset('tips')
sns.set_style('darkgrid')
ax = sns.scatterplot(x='total_bill', y='tip', hue='smoker', style="smoker",data=tips,legend=False)
plt.show()
组合一下
OK,当然,这个方法不算真正解决这个问题,大家有知道怎么把legend画在图像外面的请大家给我留言
