vue中使用axios从后台获取数据到echarts中,实现数据联动
基于若依
最近在若依这个前后端分离项目的基础上开发一些自己的功能。
主要功能是在vue中使用axios异步技术来从springboot后台获取数据库中的数据到echarts中。
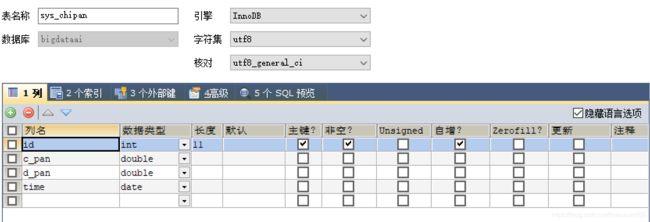
首先导入前后端代码:
-
生成的main是后端代码,前端代码在vue中。

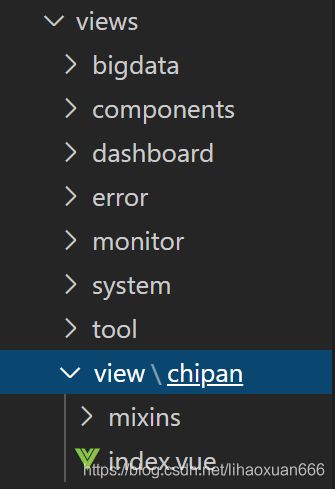
将vue中的api文件夹下的view,放到项目的api文件夹下。如图
将vue中views文件夹下的view放入到,项目的views下。

到此这个模块的框架就搭建完成。
然后修改index.vue中的代码:
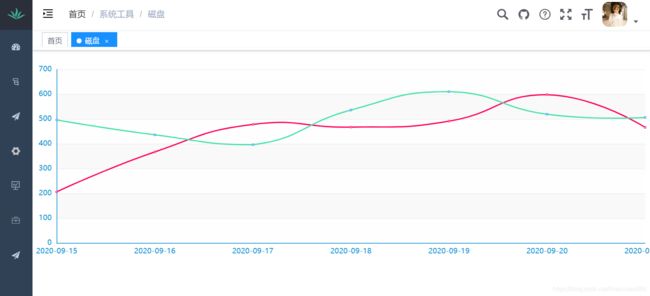
折线图:
<template>
  <div :class="className" :style="{height:height,width:width}" />
</template>

<script>
import echarts from 'echarts'
require('echarts/theme/macarons') // echarts theme
import resize from './mixins/resize'
import axios from 'axios'  //@/utils/request.js
import {
     listChipan} from '@/api/view/chipan'

export default {

  mixins: [resize],
  props: {

    className: {

      type: String,
      default: 'chart'
    },
    width: {

      type: String,
      default: '100%'
    },
    height: {

      type: String,
      default: '350px'
    },
    autoResize: {

      type: Boolean,
      default: true
    },
    chartData: {

      type: Object,
      required: true
    }
  },

   data() {

      return {

        chart: null,
        chipanList:[],
        rows:[],
        LineList:[],
         cPan:[],
        dPan:[],
        time :[],
        queryParams: {

           cPan: undefined,
          dPan: undefined,
          time: undefined,
        },
      }
    },

  mounted() {
        //mounted 代表最先执行它
    this.$nextTick(() => {
        //nextTick:简单的理解是:当数据更新了,在dom中渲染后,自动执行该函数,
      this.initChart()
    })
  },

  beforeDestroy() {

    if (!this.chart) {

      return
    }
    this.chart.dispose()
    this.chart = null
  },

  created(){

      this.getList();
  },

  methods: {

    /** 查询磁盘列表 */
   getList() {

      this.loading = true;
      listChipan(this.queryParams).then(response => {

        this.chipanList = response.rows;
        console.log("折线图数据"+this.chipanList);
        let chipanList = this.chipanList;

         if(chipanList) {

            let obj = eval(chipanList);      //eval() 函数可计算某个字符串,并执行其中的的 JavaScript 代码。返回值是通过计算 string 而得到的值
            console.log(obj);
            for (let i = 0; i < obj.length; i++) {

              this. cPan.push(chipanList[i]. cPan);
            }
            // console.log(this. cPan);
            for (let i = 0; i < obj.length; i++) {

              this.dPan.push(chipanList[i].dPan);
            }
            for (let i = 0; i < obj.length; i++) {

              this.time.push(chipanList[i].time);
            }
          }

           this.chart.setOption({

            xAxis: {

              data: this.time
            },
            series: [{

              name: 'Cpan',
              data: this. cPan,
            },
              {

                name: 'Dpan',
                data: this.dPan,
              }]
          });

      });
    },

    initChart() {

        this.chart = echarts.init(this.$el, 'macarons')
        this.chart.setOption({

          xAxis: {

            data: this.time,
            boundaryGap: false,
            axisTick: {

              show: false
            }
          },
          grid: {

            left: 10,
            right: 10,
            bottom: 20,
            top: 30,
            containLabel: true
          },
          tooltip: {

            trigger: 'axis',
            axisPointer: {

              type: 'cross'
            },
            padding: [5, 10]
          },
          yAxis: {

            axisTick: {

              show: false
            }
          },
          legend: {

            data: ['入库金额', '出库金额'],
            textStyle:{

              color: 'white'
            }
          },
          series: [{

            name: '入库金额', itemStyle: {

              normal: {

                color: '#FF005A',
                lineStyle: {

                  color: '#FF005A',
                  width: 2
                }
              }
            },
            smooth: true,
            type: 'line',
            data:  this. cPan,
            animationDuration: 2800,
            animationEasing: 'cubicInOut'
          },
            {

              name: '出库金额',
              smooth: true,
              type: 'line',
              itemStyle: {

                normal: {

                  color: '#3888fa',
                  lineStyle: {

                    color: '#45E4A5',
                    width: 2
                  },
                }
              },
              data: this.dPan,
              animationDuration: 2800,
              animationEasing: 'quadraticOut'
            }]
        })
      },


  }
}
</script>

