Pandas学习笔记(包括示例代码、运算结果及详细注释)
- 1.Series
- 2.DataFrame的简单运用
- 3.pandas选择数据
-
- 3.1 实战筛选
- 3.2 筛选总结
- 4.Pandas设置值
-
- 4.1 创建数据
- 4.2 根据位置设置loc和iloc
- 4.3 根据条件设置
- 4.4 按行或列设置
- 4.5 添加Series序列(长度必须对齐)
- 4.6 设定某行某列为特定值
- 4.7 修改一整行数据
- 5.Pandas处理丢失数据
-
- 5.1 创建含NaN的矩阵
- 5.2 删除有NaN的行或列
- 5.3 替换NaN值为0或者其他
- 5.4 是否有缺失数据NaN
- 6.Pandas导入导出
-
- 6.1 导入数据
- 6.2 导出数据
- 7.Pandas合并操作
-
- 7.1 Pandas合并
-
- 7.1.1 concat
- 7.1.2 append添加数据
- 7.1.3 两种常用合并方式总结
- 7.2.Pandas 合并 merge
-
- 7.2.1 定义资料集并打印
- 7.2.2 依据key column合并
- 7.2.3 两列合并
- 7.2.4 Indicator设置合并列名称
- 7.2.5 依据index合并
- 7.2.6 解决overlapping的问题
- 8.Pandas plot出图
Pandas 是基于NumPy 的一种工具,该工具是为了解决数据分析任务而创建的。Pandas 纳入了大量库和一些标准的数据模型,提供了高效地操作大型数据集所需的工具。Pandas提供了大量能使我们快速便捷地处理数据的函数和方法。它也是使Python成为强大而高效的数据分析环境的重要因素之一。
若对Numpy不够了解,可以参考我的另一篇博客:https://blog.csdn.net/strivequeen/article/details/112984264
1.Series
import pandas as pd
import numpy as np
s = pd.Series([1,3,6,np.nan,44,1])
print(s)  # 默认index从0开始,如果想要按照自己的索引设置,则修改index参数,如:index=[3,4,3,7,8,9]
0     1.0
1     3.0
2     6.0
3     NaN
4    44.0
5     1.0
dtype: float64
2.DataFrame的简单运用
DataFrame 既有行索引也有列索引, 它可以被看做由 Series 组成的大字典。
# 指定行标签和列标签的数据
dates = pd.date_range('2021-01-31',periods=6)
# dates = pd.date_range('2021-01-31','2021-02-05') # 起始、结束  与上述等价
'''
numpy.random.randn(d0, d1, …, dn)是从标准正态分布中返回一个或多个样本值。
numpy.random.rand(d0, d1, …, dn)的随机样本位于[0, 1)中。
(6,4)表示6行4列数据
'''
df = pd.DataFrame(np.random.randn(6,4),index=dates,columns=['a','b','c','d'])

print(df)
                   a         b         c         d
2021-01-31 -0.089777 -0.004411  1.032583  2.570713
2021-02-01 -0.918877  0.600092 -0.711374 -0.087149
2021-02-02  0.000248  0.956044 -0.256532 -2.224948
2021-02-03  1.537203 -1.313810  1.283764 -0.412839
2021-02-04 -0.010970 -0.789566 -0.307353 -0.498532
2021-02-05  0.324443  0.201022  0.956131 -1.140553

print(df['b'])
2021-01-31   -0.004411
2021-02-01    0.600092
2021-02-02    0.956044
2021-02-03   -1.313810
2021-02-04   -0.789566
2021-02-05    0.201022
Freq: D, Name: b, dtype: float64
# 未指定行标签和列标签的数据
df1 = pd.DataFrame(np.arange(12).reshape(3,4))
print(df1)
   0  1   2   3
0  0  1   2   3
1  4  5   6   7
2  8  9  10  11

# 另一种方式
df2 = pd.DataFrame({

    'A': [1,2,3,4],
    'B': pd.Timestamp('20210131'),
    'C': pd.Series([1,6,9,10],dtype='float32'),
    'D': np.array([3] * 4,dtype='int32'),
    'E': pd.Categorical(['test','train','test','train']),
    'F': 'foo'
})
print(df2)
   A          B     C  D      E    F
0  1 2021-01-31   1.0  3   test  foo
1  2 2021-01-31   6.0  3  train  foo
2  3 2021-01-31   9.0  3   test  foo
3  4 2021-01-31  10.0  3  train  foo

print(df2.index)
RangeIndex(start=0, stop=4, step=1)

print(df2.columns)
Index(['A', 'B', 'C', 'D', 'E', 'F'], dtype='object')

print(df2.values)
[[1 Timestamp('2021-01-31 00:00:00') 1.0 3 'test' 'foo']
 [2 Timestamp('2021-01-31 00:00:00') 6.0 3 'train' 'foo']
 [3 Timestamp('2021-01-31 00:00:00') 9.0 3 'test' 'foo']
 [4 Timestamp('2021-01-31 00:00:00') 10.0 3 'train' 'foo']]

# 数据总结
print(df2.describe())  # 只对数字数据进行描述
              A          C    D
count  4.000000   4.000000  4.0
mean   2.500000   6.500000  3.0
std    1.290994   4.041452  0.0
min    1.000000   1.000000  3.0
25%    1.750000   4.750000  3.0
50%    2.500000   7.500000  3.0
75%    3.250000   9.250000  3.0
max    4.000000  10.000000  3.0

# 翻转数据
print(df2.T)   # print(np.transpose(df2))为等价操作

                     0                    1                    2  \
A                    1                    2                    3
B  2021-01-31 00:00:00  2021-01-31 00:00:00  2021-01-31 00:00:00
C                    1                    6                    9
D                    3                    3                    3
E                 test                train                 test
F                  foo                  foo                  foo

                     3
A                    4
B  2021-01-31 00:00:00
C                   10
D                    3
E                train
F                  foo

'''
axis=1表示行
axis=0表示列
默认ascending(升序)为True。ascending=True表示升序,ascending=False表示降序
'''
print(df2.sort_index(axis=1,ascending=True))
   A          B     C  D      E    F
0  1 2021-01-31   1.0  3   test  foo
1  2 2021-01-31   6.0  3  train  foo
2  3 2021-01-31   9.0  3   test  foo
3  4 2021-01-31  10.0  3  train  foo

print(df2.sort_index(axis=1,ascending=False))
     F      E  D     C          B  A
0  foo   test  3   1.0 2021-01-31  1
1  foo  train  3   6.0 2021-01-31  2
2  foo   test  3   9.0 2021-01-31  3
3  foo  train  3  10.0 2021-01-31  4

print(df2.sort_index(axis=0,ascending=False))   # 表示按列降序与按列升序
   A          B     C  D      E    F
3  4 2021-01-31  10.0  3  train  foo
2  3 2021-01-31   9.0  3   test  foo
1  2 2021-01-31   6.0  3  train  foo
0  1 2021-01-31   1.0  3   test  foo

print(df2.sort_index(axis=0,ascending=True))
   A          B     C  D      E    F
0  1 2021-01-31   1.0  3   test  foo
1  2 2021-01-31   6.0  3  train  foo
2  3 2021-01-31   9.0  3   test  foo
3  4 2021-01-31  10.0  3  train  foo

# 对特定列数值排列
print(df2.sort_values(by='C',ascending=False))   # 表示对C列降序排列
   A          B     C  D      E    F
3  4 2021-01-31  10.0  3  train  foo
2  3 2021-01-31   9.0  3   test  foo
1  2 2021-01-31   6.0  3  train  foo
0  1 2021-01-31   1.0  3   test  foo
3.pandas选择数据
3.1 实战筛选
dates = pd.date_range('20210131', periods=6)
df = pd.DataFrame(np.arange(24).reshape((6,4)),index=dates, columns=['A','B','C','D'])
print(df)
             A   B   C   D
2021-01-31   0   1   2   3
2021-02-01   4   5   6   7
2021-02-02   8   9  10  11
2021-02-03  12  13  14  15
2021-02-04  16  17  18  19
2021-02-05  20  21  22  23

print(df.A)  # 与 print(df['A']) 等价
2021-01-31     0
2021-02-01     4
2021-02-02     8
2021-02-03    12
2021-02-04    16
2021-02-05    20
Freq: D, Name: A, dtype: int32

# 选择跨越多行或多列
print(df[0:3])  # 选取前3行,与 print(df['2021-01-31':'2021-02-02']) 等价
            A  B   C   D
2021-01-31  0  1   2   3
2021-02-01  4  5   6   7
2021-02-02  8  9  10  11

# 根据标签选择数据,获取特定行或列
print(df.loc['20210202'])  # 指定行数据
A     8
B     9
C    10
D    11
Name: 2021-02-02 00:00:00, dtype: int32

# 指定列
print(df.loc[:,'A':'B'])   # 与 print(df.loc[:,['A','B']]) 等价
             A   B
2021-01-31   0   1
2021-02-01   4   5
2021-02-02   8   9
2021-02-03  12  13
2021-02-04  16  17
2021-02-05  20  21

# 行与列同时检索
print(df.loc['20210131',['A','B']])
A    0
B    1
Name: 2021-01-31 00:00:00, dtype: int32

# 根据序列iloc,获取特定位置的值
print(df.iloc[3,1])
13

print(df.iloc[3:5,1:3]) # 不包含末尾5或3,同列表切片
             B   C
2021-02-03  13  14
2021-02-04  17  18

# 跨行操作
print(df.iloc[[1,3,5],1:3])
             B   C
2021-02-01   5   6
2021-02-03  13  14
2021-02-05  21  22

print(df.iloc[:3,[0,2]]) # 混合选择
            A   C
2021-01-31  0   2
2021-02-01  4   6
2021-02-02  8  10

# 通过判断的筛选
print(df[df.A>8])  # 与 print(df.loc[df.A>8]) 等价
             A   B   C   D
2021-02-03  12  13  14  15
2021-02-04  16  17  18  19
2021-02-05  20  21  22  23
3.2 筛选总结
-
iloc与ix
相同点:iloc可以取相应的值,操作方便,与ix操作类似。
不同点:ix可以混合选择,可以填入column对应的字符选择,而iloc只能采用index索引,对于列数较多情况下,ix要方便操作许多。 -
loc与iloc
相同点:都可以索引处块数据
不同点:iloc可以检索对应值,两者操作不同。
3.ix与loc、iloc
ix是混合loc与iloc操作
print(df.loc['20210131','A':'B'])
print(df.iloc[0,0:2])
print(df.ix[0,'A':'B'])
# 以上三种结果均为:
A    0
B    1
Name: 2021-01-31 00:00:00, dtype: int32
4.Pandas设置值
4.1 创建数据
# 创建数据
dates = pd.date_range('20210131',periods=6)
df = pd.DataFrame(np.arange(24).reshape(6,4), index=dates, columns=['A','B','C','D'])
print(df)

             A   B   C   D
2021-01-31   0   1   2   3
2021-02-01   4   5   6   7
2021-02-02   8   9  10  11
2021-02-03  12  13  14  15
2021-02-04  16  17  18  19
2021-02-05  20  21  22  23
4.2 根据位置设置loc和iloc
# 根据位置设置loc和iloc
df.iloc[2,2] = 111
df.loc['20210131','B'] = 2222
print(df)
             A     B    C   D
2021-01-31   0  2222    2   3
2021-02-01   4     5    6   7
2021-02-02   8     9  111  11
2021-02-03  12    13   14  15
2021-02-04  16    17   18  19
2021-02-05  20    21   22  23
4.3 根据条件设置
# 更改B中的数,而更改的位置取决于4的位置,并设相应位置的数为0
df.B[df.A>4] = 0  # 与 df.B.loc[df.A>4] = 0 等价
print(df)
             A     B    C   D
2021-01-31   0  2222    2   3
2021-02-01   4     5    6   7
2021-02-02   8     0  111  11
2021-02-03  12     0   14  15
2021-02-04  16     0   18  19
2021-02-05  20     0   22  23
4.4 按行或列设置
df['F'] = np.nan   # 列批处理,F列全改为NaN
print(df)
             A     B    C   D   F
2021-01-31   0  2222    2   3 NaN
2021-02-01   4     5    6   7 NaN
2021-02-02   8     0  111  11 NaN
2021-02-03  12     0   14  15 NaN
2021-02-04  16     0   18  19 NaN
2021-02-05  20     0   22  23 NaN
4.5 添加Series序列(长度必须对齐)
df['E'] = pd.Series([1,2,3,4,5,6], index=pd.date_range('20210131',periods=6))
print(df)
             A     B    C   D   F  E
2021-01-31   0  2222    2   3 NaN  1
2021-02-01   4     5    6   7 NaN  2
2021-02-02   8     0  111  11 NaN  3
2021-02-03  12     0   14  15 NaN  4
2021-02-04  16     0   18  19 NaN  5
2021-02-05  20     0   22  23 NaN  6
4.6 设定某行某列为特定值
#ix 以后要剥离了,尽量不要用了

df.loc['20210131','A'] = 67  # 与 df.iloc[0,0] = 67 等价
print(df)
             A     B    C   D   F  E
2021-01-31  67  2222    2   3 NaN  1
2021-02-01   4     5    6   7 NaN  2
2021-02-02   8     0  111  11 NaN  3
2021-02-03  12     0   14  15 NaN  4
2021-02-04  16     0   18  19 NaN  5
2021-02-05  20     0   22  23 NaN  6
4.7 修改一整行数据
df.iloc[1] = np.nan # df.iloc[1,:]=np.nan
print(df)
               A       B      C     D   F    E
2021-01-31  67.0  2222.0    2.0   3.0 NaN  1.0
2021-02-01   NaN     NaN    NaN   NaN NaN  NaN
2021-02-02   8.0     0.0  111.0  11.0 NaN  3.0
2021-02-03  12.0     0.0   14.0  15.0 NaN  4.0
2021-02-04  16.0     0.0   18.0  19.0 NaN  5.0
2021-02-05  20.0     0.0   22.0  23.0 NaN  6.0

df.loc['20210131'] = np.nan # df.loc['20210131,:']=np.nan
print(df)
               A    B      C     D   F    E
2021-01-31   NaN  NaN    NaN   NaN NaN  NaN
2021-02-01   NaN  NaN    NaN   NaN NaN  NaN
2021-02-02   8.0  0.0  111.0  11.0 NaN  3.0
2021-02-03  12.0  0.0   14.0  15.0 NaN  4.0
2021-02-04  16.0  0.0   18.0  19.0 NaN  5.0
2021-02-05  20.0  0.0   22.0  23.0 NaN  6.0
5.Pandas处理丢失数据
5.1 创建含NaN的矩阵
# 创建含NaN的矩阵
dates = pd.date_range('20210131',periods=6)
df = pd.DataFrame(np.arange(24).reshape((6,4)),index=dates,columns=['A','B','C','D'])
print(df)
             A   B   C   D
2021-01-31   0   1   2   3
2021-02-01   4   5   6   7
2021-02-02   8   9  10  11
2021-02-03  12  13  14  15
2021-02-04  16  17  18  19
2021-02-05  20  21  22  23

# a.reshape(6,4)等价于a.reshape((6,4))
df.iloc[0,1] = np.nan
df.iloc[1,2] = np.nan
print(df)
             A     B     C   D
2021-01-31   0   NaN   2.0   3
2021-02-01   4   5.0   NaN   7
2021-02-02   8   9.0  10.0  11
2021-02-03  12  13.0  14.0  15
2021-02-04  16  17.0  18.0  19
2021-02-05  20  21.0  22.0  23
5.2 删除有NaN的行或列
print(df.dropna()) # 默认是删除掉含有NaN的行
             A     B     C   D
2021-02-02   8   9.0  10.0  11
2021-02-03  12  13.0  14.0  15
2021-02-04  16  17.0  18.0  19
2021-02-05  20  21.0  22.0  23

print(df.dropna(
    axis=0, # 0对行进行操作;1对列进行操作
    how='any' # 'any':只要存在NaN就drop掉;'all':必须全部是NaN才drop
))
# 结果同上

# 删除掉所有含有NaN的列
print(df.dropna(
    axis=1,
    how='any'
))
             A   D
2021-01-31   0   3
2021-02-01   4   7
2021-02-02   8  11
2021-02-03  12  15
2021-02-04  16  19
2021-02-05  20  23
5.3 替换NaN值为0或者其他
print(df.fillna(value=0))
             A     B     C   D
2021-01-31   0   0.0   2.0   3
2021-02-01   4   5.0   0.0   7
2021-02-02   8   9.0  10.0  11
2021-02-03  12  13.0  14.0  15
2021-02-04  16  17.0  18.0  19
2021-02-05  20  21.0  22.0  23
5.4 是否有缺失数据NaN
print(df.isnull())  # 与 print(df.isna()) 等价
                A      B      C      D
2021-01-31  False   True  False  False
2021-02-01  False  False   True  False
2021-02-02  False  False  False  False
2021-02-03  False  False  False  False
2021-02-04  False  False  False  False
2021-02-05  False  False  False  False

# 检测某列是否有缺失数据NaN
print(df.isnull().any())
A    False
B     True
C     True
D    False
dtype: bool

# 检测数据中是否存在NaN,如果存在就返回True
print(np.any(df.isnull())==True)
True
6.Pandas导入导出
6.1 导入数据
import pandas as pd # 加载模块
data = pd.read_csv('student.csv') # 读取csv
print(data) # 打印出data
    Student ID  name   age  gender
0         1100  Kelly   22  Female
1         1101    Clo   21  Female
2         1102  Tilly   22  Female
3         1103   Tony   24    Male
4         1104  David   20    Male
5         1105  Catty   22  Female
6         1106      M    3  Female
7         1107      N   43    Male
8         1108      A   13    Male
9         1109      S   12    Male
10        1110  David   33    Male
11        1111     Dw    3  Female
12        1112      Q   23    Male
13        1113      W   21  Female

print(data.head(3)) # 前三行
   Student ID  name   age  gender
0        1100  Kelly   22  Female
1        1101    Clo   21  Female
2        1102  Tilly   22  Female

print(data.tail(3)) # 后三行
    Student ID name   age  gender
11        1111    Dw    3  Female
12        1112     Q   23    Male
13        1113     W   21  Female
6.2 导出数据
# 将资料存取成pickle
data.to_pickle('student.pickle')
# 读取pickle文件并打印
print(pd.read_pickle('student.pickle'))
7.Pandas合并操作
7.1 Pandas合并
7.1.1 concat
# 定义资料集
df1 = pd.DataFrame(np.ones((3,4))*0, columns=['a','b','c','d'])
df2 = pd.DataFrame(np.ones((3,4))*1, columns=['a','b','c','d'])
df3 = pd.DataFrame(np.ones((3,4))*2, columns=['a','b','c','d'])
print(df1)
     a    b    c    d
0  0.0  0.0  0.0  0.0
1  0.0  0.0  0.0  0.0
2  0.0  0.0  0.0  0.0

print(df2)
     a    b    c    d
0  1.0  1.0  1.0  1.0
1  1.0  1.0  1.0  1.0
2  1.0  1.0  1.0  1.0

print(df3)
     a    b    c    d
0  2.0  2.0  2.0  2.0
1  2.0  2.0  2.0  2.0
2  2.0  2.0  2.0  2.0

# concat纵向合并
res = pd.concat([df1,df2,df3],axis=0)
print(res)
     a    b    c    d
0  0.0  0.0  0.0  0.0
1  0.0  0.0  0.0  0.0
2  0.0  0.0  0.0  0.0
0  1.0  1.0  1.0  1.0
1  1.0  1.0  1.0  1.0
2  1.0  1.0  1.0  1.0
0  2.0  2.0  2.0  2.0
1  2.0  2.0  2.0  2.0
2  2.0  2.0  2.0  2.0

# 上述合并过程中,index重复,重置index方法:只需要将index_ignore设定为True即可
res = pd.concat([df1,df2,df3],axis=0,ignore_index=True)
print(res)
     a    b    c    d
0  0.0  0.0  0.0  0.0
1  0.0  0.0  0.0  0.0
2  0.0  0.0  0.0  0.0
3  1.0  1.0  1.0  1.0
4  1.0  1.0  1.0  1.0
5  1.0  1.0  1.0  1.0
6  2.0  2.0  2.0  2.0
7  2.0  2.0  2.0  2.0
8  2.0  2.0  2.0  2.0

# join 合并方式
#定义资料集
df1 = pd.DataFrame(np.ones((3,4))*0, columns=['a','b','c','d'], index=[1,2,3])
df2 = pd.DataFrame(np.ones((3,4))*1, columns=['b','c','d','e'], index=[2,3,4])
print(df1)
     a    b    c    d
1  0.0  0.0  0.0  0.0
2  0.0  0.0  0.0  0.0
3  0.0  0.0  0.0  0.0
print(df2)
     b    c    d    e
2  1.0  1.0  1.0  1.0
3  1.0  1.0  1.0  1.0
4  1.0  1.0  1.0  1.0

'''
join='outer',函数默认为join='outer'。此方法是依照column来做纵向合并,有相同的column上下合并在一起,
其他独自的column各自成列,原来没有值的位置皆为NaN填充。
'''
# 纵向"外"合并df1与df2
res = pd.concat([df1,df2],axis=0,join='outer')
print(res)
     a    b    c    d    e
1  0.0  0.0  0.0  0.0  NaN
2  0.0  0.0  0.0  0.0  NaN
3  0.0  0.0  0.0  0.0  NaN
2  NaN  1.0  1.0  1.0  1.0
3  NaN  1.0  1.0  1.0  1.0
4  NaN  1.0  1.0  1.0  1.0

# 修改index
res = pd.concat([df1,df2],axis=0,join='outer',ignore_index=True)
print(res)
     a    b    c    d    e
0  0.0  0.0  0.0  0.0  NaN
1  0.0  0.0  0.0  0.0  NaN
2  0.0  0.0  0.0  0.0  NaN
3  NaN  1.0  1.0  1.0  1.0
4  NaN  1.0  1.0  1.0  1.0
5  NaN  1.0  1.0  1.0  1.0

# join='inner'合并相同的字段,纵向"内"合并df1与df2
res = pd.concat([df1,df2],axis=0,join='inner')
print(res)
     b    c    d
1  0.0  0.0  0.0
2  0.0  0.0  0.0
3  0.0  0.0  0.0
2  1.0  1.0  1.0
3  1.0  1.0  1.0
4  1.0  1.0  1.0

# join_axes(依照axes合并)
#定义资料集
df1 = pd.DataFrame(np.ones((3,4))*0, columns=['a','b','c','d'], index=[1,2,3])
df2 = pd.DataFrame(np.ones((3,4))*1, columns=['b','c','d','e'], index=[2,3,4])
print(df1)
     a    b    c    d
1  0.0  0.0  0.0  0.0
2  0.0  0.0  0.0  0.0
3  0.0  0.0  0.0  0.0
print(df2)
     b    c    d    e
2  1.0  1.0  1.0  1.0
3  1.0  1.0  1.0  1.0
4  1.0  1.0  1.0  1.0

# 横向合并
res = pd.concat([df1,df2],axis=1)
print(res)
     a    b    c    d    b    c    d    e
1  0.0  0.0  0.0  0.0  NaN  NaN  NaN  NaN
2  0.0  0.0  0.0  0.0  1.0  1.0  1.0  1.0
3  0.0  0.0  0.0  0.0  1.0  1.0  1.0  1.0
4  NaN  NaN  NaN  NaN  1.0  1.0  1.0  1.0
7.1.2 append添加数据
# append只有纵向合并,没有横向合并
#定义资料集
df1 = pd.DataFrame(np.ones((3,4))*0, columns=['a','b','c','d'])
df2 = pd.DataFrame(np.ones((3,4))*1, columns=['a','b','c','d'])
df3 = pd.DataFrame(np.ones((3,4))*2, columns=['a','b','c','d'])
s1 = pd.Series([1,2,3,4], index=['a','b','c','d'])
# 将df2合并到df1下面,以及重置index,并打印出结果
res = df1.append(df2,ignore_index=True)
print(res)
     a    b    c    d
0  0.0  0.0  0.0  0.0
1  0.0  0.0  0.0  0.0
2  0.0  0.0  0.0  0.0
3  1.0  1.0  1.0  1.0
4  1.0  1.0  1.0  1.0
5  1.0  1.0  1.0  1.0

# 合并多个df,将df2与df3合并至df1的下面,以及重置index,并打印出结果
res = df1.append([df2,df3], ignore_index=True)
print(res)
     a    b    c    d
0  0.0  0.0  0.0  0.0
1  0.0  0.0  0.0  0.0
2  0.0  0.0  0.0  0.0
3  1.0  1.0  1.0  1.0
4  1.0  1.0  1.0  1.0
5  1.0  1.0  1.0  1.0
6  2.0  2.0  2.0  2.0
7  2.0  2.0  2.0  2.0
8  2.0  2.0  2.0  2.0

# 合并series,将s1合并至df1,以及重置index,并打印结果
res = df1.append(s1,ignore_index=True)
print(res)
     a    b    c    d
0  0.0  0.0  0.0  0.0
1  0.0  0.0  0.0  0.0
2  0.0  0.0  0.0  0.0
3  1.0  2.0  3.0  4.0
7.1.3 两种常用合并方式总结
res = pd.concat([df1, df2, df3], axis=0, ignore_index=True)
res1 = df1.append([df2, df3], ignore_index=True)
# 上述两种结果一样:
     a    b    c    d
0  0.0  0.0  0.0  0.0
1  0.0  0.0  0.0  0.0
2  0.0  0.0  0.0  0.0
3  1.0  1.0  1.0  1.0
4  1.0  1.0  1.0  1.0
5  1.0  1.0  1.0  1.0
6  2.0  2.0  2.0  2.0
7  2.0  2.0  2.0  2.0
8  2.0  2.0  2.0  2.0
7.2.Pandas 合并 merge
7.2.1 定义资料集并打印
# 依据一组key合并
# 定义资料集并打印出
left = pd.DataFrame({
     'key' : ['K0','K1','K2','K3'],
                     'A' : ['A0','A1','A2','A3'],
                     'B' : ['B0','B1','B2','B3']})

right = pd.DataFrame({
     'key': ['K0', 'K1', 'K2', 'K3'],
                      'C' : ['C0', 'C1', 'C2', 'C3'],
                      'D' : ['D0', 'D1', 'D2', 'D3']})
print(left)
  key   A   B
0  K0  A0  B0
1  K1  A1  B1
2  K2  A2  B2
3  K3  A3  B3
print(right)
  key   C   D
0  K0  C0  D0
1  K1  C1  D1
2  K2  C2  D2
3  K3  C3  D3
7.2.2 依据key column合并
res = pd.merge(left,right,on='key')
print(res)
  key   A   B   C   D
0  K0  A0  B0  C0  D0
1  K1  A1  B1  C1  D1
2  K2  A2  B2  C2  D2
3  K3  A3  B3  C3  D3
7.2.3 两列合并
#  依据两组key合并
#定义资料集并打印出
left = pd.DataFrame({
     'key1': ['K0', 'K0', 'K1', 'K2'],
                      'key2': ['K0', 'K1', 'K0', 'K1'],
                      'A': ['A0', 'A1', 'A2', 'A3'],
                      'B': ['B0', 'B1', 'B2', 'B3']})
right = pd.DataFrame({
     'key1': ['K0', 'K1', 'K1', 'K2'],
                       'key2': ['K0', 'K0', 'K0', 'K0'],
                       'C': ['C0', 'C1', 'C2', 'C3'],
                       'D': ['D0', 'D1', 'D2', 'D3']})
print(left)
  key1 key2   A   B
0   K0   K0  A0  B0
1   K0   K1  A1  B1
2   K1   K0  A2  B2
3   K2   K1  A3  B3
print(right)
  key1 key2   C   D
0   K0   K0  C0  D0
1   K1   K0  C1  D1
2   K1   K0  C2  D2
3   K2   K0  C3  D3

# 依据key1与key2 columns进行合并,并打印出四种结果['left', 'right', 'outer', 'inner']
res = pd.merge(left, right, on=['key1', 'key2'], how='inner')
print(res)
  key1 key2   A   B   C   D
0   K0   K0  A0  B0  C0  D0
1   K1   K0  A2  B2  C1  D1
2   K1   K0  A2  B2  C2  D2

res = pd.merge(left, right, on=['key1', 'key2'], how='outer')
print(res)
  key1 key2    A    B    C    D
0   K0   K0   A0   B0   C0   D0
1   K0   K1   A1   B1  NaN  NaN
2   K1   K0   A2   B2   C1   D1
3   K1   K0   A2   B2   C2   D2
4   K2   K1   A3   B3  NaN  NaN
5   K2   K0  NaN  NaN   C3   D3

res = pd.merge(left, right, on=['key1', 'key2'], how='left')
print(res)
  key1 key2   A   B    C    D
0   K0   K0  A0  B0   C0   D0
1   K0   K1  A1  B1  NaN  NaN
2   K1   K0  A2  B2   C1   D1
3   K1   K0  A2  B2   C2   D2
4   K2   K1  A3  B3  NaN  NaN

res = pd.merge(left, right, on=['key1', 'key2'], how='right')
print(res)
  key1 key2    A    B   C   D
0   K0   K0   A0   B0  C0  D0
1   K1   K0   A2   B2  C1  D1
2   K1   K0   A2   B2  C2  D2
3   K2   K0  NaN  NaN  C3  D3
7.2.4 Indicator设置合并列名称
df1 = pd.DataFrame({
     'col1':[0,1],'col_left':['a','b']})
df2 = pd.DataFrame({
     'col1':[1,2,2],'col_right':[2,2,2]})
print(df1)
   col1 col_left
0     0        a
1     1        b
print(df2)
   col1  col_right
0     1          2
1     2          2
2     2          2

# 依据col1进行合并,并启用indicator=True,最后打印
res = pd.merge(df1,df2,on='col1',how='outer',indicator=True)
print(res)
   col1 col_left  col_right      _merge
0     0        a        NaN   left_only
1     1        b        2.0        both
2     2      NaN        2.0  right_only
3     2      NaN        2.0  right_only

# 自定义indicator column的名称,并打印出
res = pd.merge(df1,df2,on='col1',how='outer',indicator='indicator_column')
print(res)
   col1 col_left  col_right indicator_column
0     0        a        NaN        left_only
1     1        b        2.0             both
2     2      NaN        2.0       right_only
3     2      NaN        2.0       right_only
7.2.5 依据index合并
left = pd.DataFrame({
     'A': ['A0', 'A1', 'A2'],
                     'B': ['B0', 'B1', 'B2']},
                     index=['K0', 'K1', 'K2'])
right = pd.DataFrame({
     'C': ['C0', 'C2', 'C3'],
                      'D': ['D0', 'D2', 'D3']},
                     index=['K0', 'K2', 'K3'])
print(left)
     A   B
K0  A0  B0
K1  A1  B1
K2  A2  B2
print(right)
     C   D
K0  C0  D0
K2  C2  D2
K3  C3  D3

# 依据左右资料集的index进行合并,how='outer',并打印
res = pd.merge(left,right,left_index=True,right_index=True,how='outer')
print(res)
      A    B    C    D
K0   A0   B0   C0   D0
K1   A1   B1  NaN  NaN
K2   A2   B2   C2   D2
K3  NaN  NaN   C3   D3

# 依据左右资料集的index进行合并,how='inner',并打印
res = pd.merge(left,right,left_index=True,right_index=True,how='inner')
print(res)
     A   B   C   D
K0  A0  B0  C0  D0
K2  A2  B2  C2  D2
7.2.6 解决overlapping的问题
boys = pd.DataFrame({
     'k': ['K0', 'K1', 'K2'], 'age': [1, 2, 3]})
girls = pd.DataFrame({
     'k': ['K0', 'K0', 'K3'], 'age': [4, 5, 6]})
print(boys)
    k  age
0  K0    1
1  K1    2
2  K2    3
print(girls)
    k  age
0  K0    4
1  K0    5
2  K3    6

# 使用suffixes解决overlapping的问题
# 比如将上面两个合并时,age重复了,则可通过suffixes设置,以此保证不重复,不同名
res = pd.merge(boys,girls,on='k',suffixes=['_boy','_girl'],how='inner')
print(res)
    k  age_boy  age_girl
0  K0        1         4
1  K0        1         5
8.Pandas plot出图
import pandas as pd
import numpy as np
import matplotlib.pyplot as plt

data = pd.Series(np.random.randn(1000), index=np.arange(1000))
print(data)
0     -0.090306
1      0.537896
2      0.577394
3      0.298975
4     -0.506510
         ...
995    0.243735
996    0.462577
997    0.054838
998   -0.514172
999   -0.592451
Length: 1000, dtype: float64

print(data.cumsum())
0      -0.090306
1       0.447590
2       1.024985
3       1.323960
4       0.817450
         ...
995    20.989576
996    21.452154
997    21.506992
998    20.992820
999    20.400369
Length: 1000, dtype: float64

# data本来就是一个数据,所以我们可以直接plot
data.plot()
plt.show()

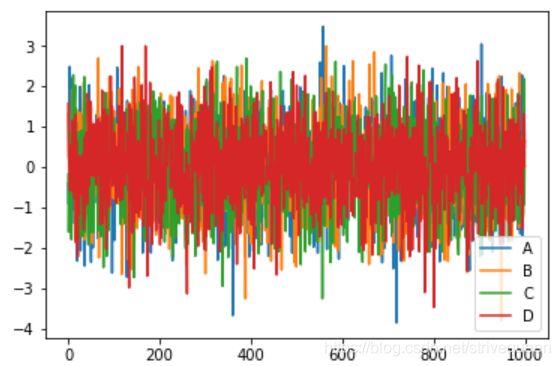
# np.random.randn(1000,4) 随机生成1000行4列数据
# list("ABCD")会变为['A','B','C','D']
data = pd.DataFrame(
    np.random.randn(1000,4),
    index=np.arange(1000),
    columns=list("ABCD")
)
data.cumsum()
data.plot()
plt.show()
ax = data.plot.scatter(x='A',y='B',color='DarkBlue',label='Class1')
# 将之下这个 data 画在上一个 ax 上面
data.plot.scatter(x='A',y='C',color='LightGreen',label='Class2',ax=ax)
plt.show()
