v1版pyecharts,初识如何看官方文档,时间轴,饼图,柱状图,折线图,词云实例
- 闲话
相信有些同学在编程时会遇到传递参数数据类型、属性取值、如何设置样式等问题,这个时候建议看文档,毕竟不可能一辈子在百度找人家的教程,看文档的能力是要具备的。找不到方法很难看懂文档,下面是我的一些见解,希望有所帮助。
pyecharts官方文档
如何看懂pyecharts官方文档
- 链式调用
链式调用格式
from pyecharts.charts import Bar

bar = (
    Bar()
    .add_xaxis(["衬衫", "羊毛衫", "雪纺衫", "裤子", "高跟鞋", "袜子"])
    .add_yaxis("商家A", [5, 20, 36, 10, 75, 90])
)
bar.render()
也可以用一般形式。
bar = Bar()
bar.add_xaxis(["衬衫", "羊毛衫", "雪纺衫", "裤子", "高跟鞋", "袜子"])
bar.add_yaxis("商家A", [5, 20, 36, 10, 75, 90])
bar.set_global_opts(title_opts=opts.TitleOpts(title="主标题", subtitle="副标题"))
bar.render()
- 全局配置
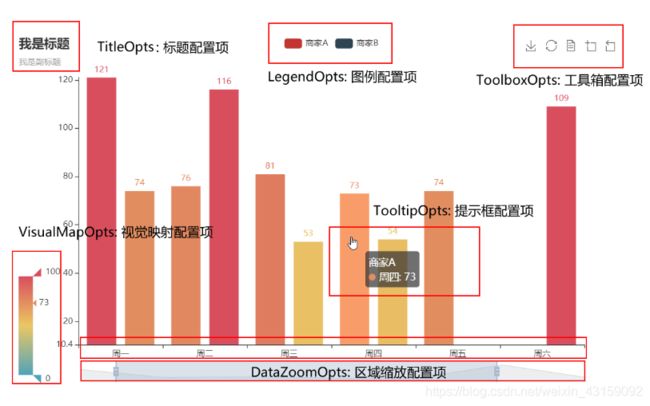
使用 options 配置项,在 pyecharts 中,一切皆 Options。
全局配置里面的配置项是所有图都可以配置的,
用set_global_options方法设置全局配置,可以配置如下方面。

图片所列出的还不是全部,但一般也够用。
配置方法示例:
from pyecharts.charts import Bar
from pyecharts import options as opts

# V1 版本开始支持链式调用
# 你所看到的格式其实是 `black` 格式化以后的效果
# 可以执行 `pip install black` 下载使用
bar = (
    Bar()
    .add_xaxis(["衬衫", "羊毛衫", "雪纺衫", "裤子", "高跟鞋", "袜子"])
    .add_yaxis("商家A", [5, 20, 36, 10, 75, 90])
    .set_global_opts(
         title_opts=opts.TitleOpts(title="主标题", subtitle="副标题"),#标题的相关配置写入括号中
         legend_opts=opts.LegendOpts(pos_right='right'),#图例配置项写入括号中
         tooltip_opts=opts.TooltipOpts()#提示框配置项写入括号中
        #以此类推,注意逗号分隔
)
    # 或者直接使用字典参数
    # .set_global_opts(title_opts={"text": "主标题", "subtext": "副标题"})
)
bar.render()
为什么要这么写?
它们都是类,例如标题配置类是这么定义的
class TitleOpts()
而options是所有配置类的包文件
所以先实例化,例如 t = opts.TitleOpts(),
t是实例对象,opts是包名,TitleOpts是类名
不过命名还是见字知义比较好,所以采用
title_opts=opts.TitleOpts()
这些类里面有哪些字段和取值就看文档的类定义了。
- 系列配置和图表API
系列配置的配置项也是所有图都能配置。用set_series_opts方法
Note: 配置项章节应该配合图表类型章节中的 example 阅读。
Base类是基类,具体的图是继承类。所有图支持如下方法:
Base 类是所有图表的基类,包括组合图表,Base 类 API 如下:
#新增 js 代码,js 代码会被渲染进 HTML 中执行
def add_js_funcs(*fns):
#设置全局 Label 颜色
def set_colors(colors: colors: Sequence[str])
#获取全局 options
def get_options() -> dict:
#获取全局 options,JSON 格式(JsCode 生成的函数不带引号)
def dump_options() -> str:
#获取全局 options,JSON 格式(JsCode 生成的函数带引号,在前后端分离传输数据时使用)
def dump_options_with_quotes() -> str:
#将图形渲染到 notebook
def render_notebook()
#加载 js 资源,在 notebook 环境为 JupyterLab 时需要用到,仅在第一次渲染图前使用加载即可。
def load_javascript()
def add_xaxis(
# X 轴数据项
xaxis_data: Sequence
)
基本图表那一类就不分x,y轴,用add()方法
看文档的步骤总结
1. 根据画图的类型,看看父类有哪些方法。(别忘了Base类,还有些其他的父类),例如RectChart类的方法仅直角坐标系图享有。
2. 类别选好了,再看具体画什么图(Bar,Scatter - - -),看这个图的类有哪些方法。
3. 每个图肯定有个主方法,就是定义了很多东西的方法,一般是add(),add_yaxis(),add_schema(),看看里面的属性和支持的配置。
4. 再根据你的需要进行属性配置、全局配置和系列配置。
5. 结果就是:配置项要么在set_global_options()中,要么就在set_series_opts()中。
6. 还有种可能,就是写在主方法中,实现单独控制,这时要看方法中支持哪些配置(即第三步),超出就会报错。比如,一个坐标轴画两个折线图,可以分别配置样式。
7.注意要根据具体图而言。
例如,日历图不仅有全局配置和系列配置,还有一个独有的日历坐标系组件配置项
8.更多细节等你发现。
#日历坐标系组件配置项,参考
CalendarOpts
calendar_opts: Union[opts.CalendarOpts, dict, None] = None,
文档介绍到这里,下面看实例
- 有很多图,例如饼图,词云,data_pair = 二维列表
[ [ “中国” , 96 ] , [ “湖北” ,33 ] ]
- 柱状图、折线图等单独传递x,y都是列表类型
- 时间轴柱状图
from pyecharts import options as opts
from pyecharts.charts import Bar, Timeline
import pandas as pd

hubei = pd.read_excel('E:/ProgramData/scrapytest/hubeidata/年底人口数.xls')#读取表格
population = pd.DataFrame(hubei)#转换为DataFrame

place = list(hubei['地区'][1:18])     #转换为list类型
population_2017 = list(hubei['报告期2017'][1:18])
population_2016 = list(hubei['报告期2016'][1:18])
population_2015 = list(hubei['报告期2015'][1:18])
population_2014 = list(hubei['报告期2014'][1:18])
population_2013 = list(hubei['报告期2013'][1:18])
y = [population_2013,population_2014,population_2015,population_2016,population_2017]

tl = Timeline()
for i in range(2013, 2018):
    bar = (
        Bar()
        .add_xaxis(place)
        .add_yaxis("人口数", y[i - 2013]) #每一年对应不同的数据
        .set_global_opts(title_opts=opts.TitleOpts("湖北{}人口数".format(i)),)
    )
    tl.add(bar, "{}年".format(i))
tl.render("hubei_population.html")
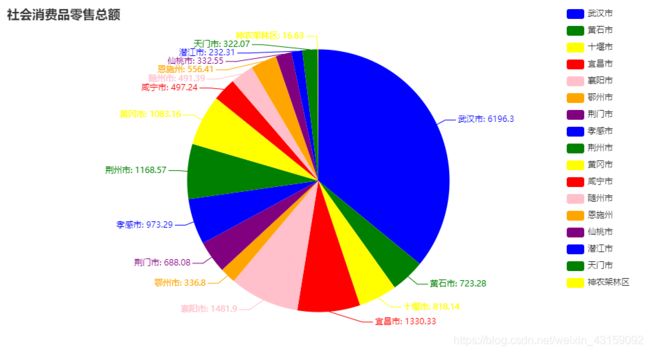
- 饼图
from pyecharts import options as opts
from pyecharts.charts import Pie
from pyecharts.faker import Faker
import pandas as pd

pay_ability = pd.read_excel('E:/ProgramData/scrapytest/hubeidata/社会消费品零售总额.xls')
place = list(pay_ability['地区'][1:18])
pay_money = list(pay_ability['报告期2017'][1:18])

data_pair = []
for i in range(0,17):#将数据转换成[['武汉市',6196.3],['黄石市',723.28],---]
    x = []
    x.append(place[i])
    x.append(pay_money[i])
    data_pair.append(x)

c = (
    Pie()
    .add(
        series_name="hhh",
        data_pair=data_pair
    )
    .set_colors(["blue", "green", "yellow", "red", "pink", "orange", "purple"])
    .set_global_opts(
        title_opts=opts.TitleOpts(title="社会消费品零售总额",pos_top = 'top',padding=[5,5,5,5]),
        legend_opts=opts.LegendOpts(pos_right='right')#解决标签重叠问题,右对齐
    )
    .set_series_opts(
        label_opts=opts.LabelOpts(formatter="{b}: {c}"),

    )
    .render("社会消费品零售总额.html")
)
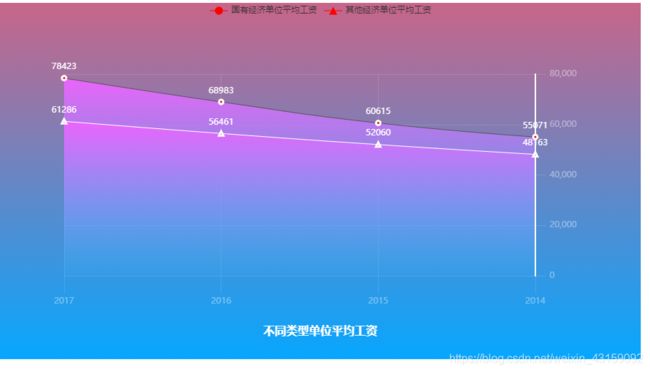
- beautiful样式折线图
import pyecharts.options as opts
from pyecharts.charts import Line, Grid
from pyecharts.commons.utils import JsCode

"""
参考地址: https://gallery.echartsjs.com/editor.html?c=xEyDk1hwBx
"""

x_data = ['2017','2016','2015','2014']
y_data1 = [78423,68983,60615,55071]
y_data2 = [61286,56461,52060,48163]

background_color_js = (
    "new echarts.graphic.LinearGradient(0, 0, 0, 1, "
    "[{offset: 0, color: '#c86589'}, {offset: 1, color: '#06a7ff'}], false)"
)
area_color_js = (
    "new echarts.graphic.LinearGradient(0, 0, 0, 1, "
    "[{offset: 0, color: '#eb64fb'}, {offset: 1, color: '#3fbbff0d'}], false)"
)

c = (
    Line(init_opts=opts.InitOpts(bg_color=JsCode(background_color_js)))
    .add_xaxis(xaxis_data=x_data)
    .add_yaxis(
        series_name="国有经济单位平均工资",
        y_axis=y_data1,
        is_smooth=True,
        is_symbol_show=True,
        symbol="circle",
        symbol_size=6,
        linestyle_opts=opts.LineStyleOpts(color="#555"),
        label_opts=opts.LabelOpts(is_show=True, position="top", color="white"),
        itemstyle_opts=opts.ItemStyleOpts(
            color="red", border_color="#fff", border_width=3
        ),
        tooltip_opts=opts.TooltipOpts(is_show=True),
        areastyle_opts=opts.AreaStyleOpts(color=JsCode(area_color_js), opacity=1),
    )
    .add_yaxis(
        series_name="其他经济单位平均工资",
        y_axis=y_data2,
        is_smooth=True,
        is_symbol_show=True,
        symbol='triangle',
        symbol_size=6,
        linestyle_opts=opts.LineStyleOpts(color="#fff"),
        label_opts=opts.LabelOpts(is_show=True, position="top", color="white"),
        itemstyle_opts=opts.ItemStyleOpts(
            color="red", border_color="#fff", border_width=3
        ),
        tooltip_opts=opts.TooltipOpts(is_show=True),
        areastyle_opts=opts.AreaStyleOpts(color=JsCode(area_color_js), opacity=1),
    )
    .set_global_opts(
        title_opts=opts.TitleOpts(
            title="不同类型单位平均工资",
            pos_bottom="5%",
            pos_left="center",
            title_textstyle_opts=opts.TextStyleOpts(color="#fff", font_size=16),
        ),
        xaxis_opts=opts.AxisOpts(
            type_="category",
            boundary_gap=False,
            axislabel_opts=opts.LabelOpts(margin=30, color="#ffffff63"),
            axisline_opts=opts.AxisLineOpts(is_show=False),
            axistick_opts=opts.AxisTickOpts(
                is_show=True,
                length=25,
                linestyle_opts=opts.LineStyleOpts(color="#ffffff1f"),
            ),
            splitline_opts=opts.SplitLineOpts(
                is_show=True, linestyle_opts=opts.LineStyleOpts(color="#ffffff1f")
            ),
        ),
        yaxis_opts=opts.AxisOpts(
            type_="value",
            position="right",
            axislabel_opts=opts.LabelOpts(margin=20, color="#ffffff63"),
            axisline_opts=opts.AxisLineOpts(
                linestyle_opts=opts.LineStyleOpts(width=2, color="#fff")
            ),
            axistick_opts=opts.AxisTickOpts(
                is_show=True,
                length=15,
                linestyle_opts=opts.LineStyleOpts(color="#ffffff1f"),
            ),
            splitline_opts=opts.SplitLineOpts(
                is_show=True, linestyle_opts=opts.LineStyleOpts(color="#ffffff1f")
            ),
        ),
        legend_opts=opts.LegendOpts(is_show=True),
    )
)

(
    Grid()
    .add(
        c,
        grid_opts=opts.GridOpts(
            pos_top="20%",
            pos_left="10%",
            pos_right="10%",
            pos_bottom="15%",
            is_contain_label=True,
        ),
    )
    .render("职工平均工资.html")
)
- 词云
from pyecharts import options as opts
from pyecharts.charts import WordCloud
from pyecharts.globals import SymbolType
word = [['大数据',30],['人工智能',35],['java+web',30],['爬虫',15],['前端',20],['Django',15],['多线程',10]]

c = (
    WordCloud()
    .add(series_name="词云",data_pair = word, shape=SymbolType.DIAMOND)
    .set_global_opts(title_opts=opts.TitleOpts(title="WordCloud-shape-diamond"))
    .render("词云.html")
)
谢谢大家
有同学发现我讲错的地方还请留言指正,有什么不全的地方也可以补充。


