Markowitz有效边界投资组合——利用python
Markowitz有效边界投资组合
一、Markowitz 有效边界投资组合理论简介
1952年,芝加哥大学的Markowitz提出现代资产组合理论(Modern Portfolio Theory,简称MPT),为现代西方证券投资理论奠定了基础。其基本思想是,证券投资的风险在于证券投资收益的不确定性。如果将收益率视为一个数学上的随机变量的话,证券的期望收益是该随机变量的数学期望(均值),而风险可以用该随机变量的方差来表示。
二、证券的选取
选取掌阅科技(603533)、贵州茅台(600519)、俄罗斯RTS(RTS)、韩国KOSPI(KS11)、新西兰50(NZ50)五只证券。
三、获取数据
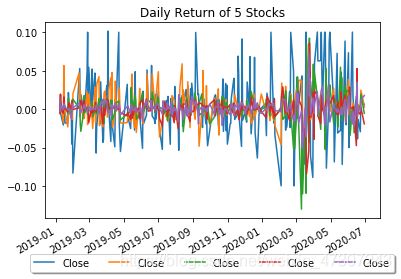
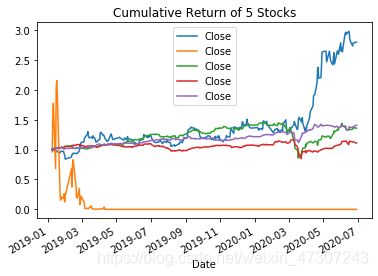
五只证券2019年1月1日至2020年6月30日数据的比较并查看各股的累积回报率,以下是五只证券的投资组合时序图:

图2
四、投资组合相关系数——各股回报率相关性
图3
从相关系数矩阵可以看出,掌阅科技 (603533)和俄罗斯RTS (RTS)是负相关,且相关性是最高的;其余的都呈正相关。如果股票之间的相关性太高,投资组合降低风险的效果就比较有限。
五、给不同资产随机分配初始权重
下面是求解资产配置比例以期待达到期望收益率时将风险最小化。由于A股不允许建立空头头寸,所有的权重系数均在0-1之间。

图4
六、夏普比率
夏普比率可以用来衡量特定风险下投资收益的表现。这个比率调整了投资的收益,使我们可以在一定规模风险的情况下比较不同的投资表现。没有规模风险的限制,我们无法比较不同证券组合的收益与风险表现。

图6
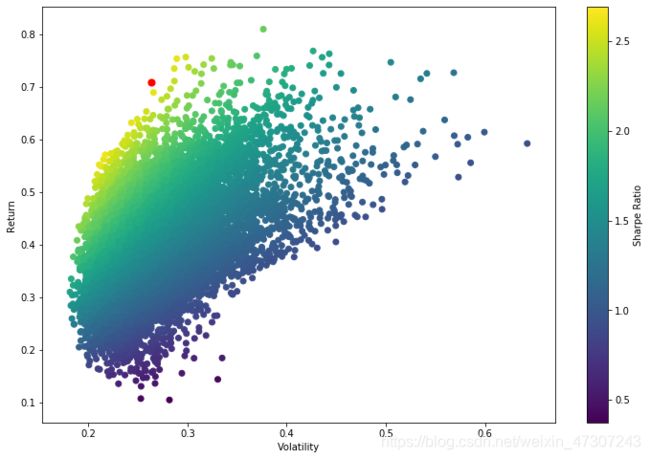
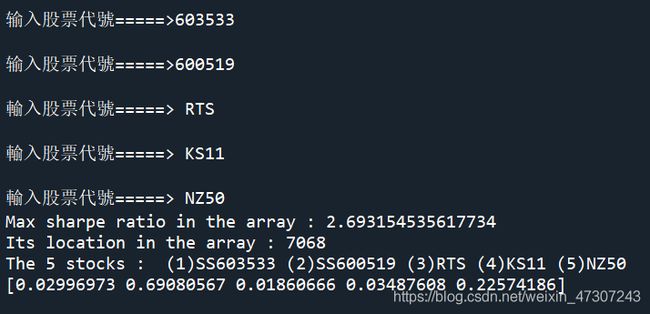
可以得出最优投资组合(夏普比率为2.693)为买入3%掌阅科技 (603533)、69.10%贵州茅台 (600519)、1.86%俄罗斯RTS (RTS)、3.49%韩国KOSPI (KS11)、22.57%新西兰50 (NZ50) ;其期望收益率为70.90%,期望波动率为26.32%。
七、运行代码
import time
import datetime
import pandas_datareader as web
import pandas as pd
import numpy as np
import matplotlib.pyplot as plt
%matplotlib inline
#**********************************************************
#**********************************************************
stock=input("输入股票代號=====>")
stockfile=stock+".SS"
#from pandas_datareader import data as web
write=pd.ExcelWriter('D:/stock.xlsx')
starttime=time.perf_counter()
star=datetime.datetime(2019,1,1)
end=datetime.datetime(2020,6,30)
df=web.DataReader(stockfile,'yahoo',star,end)
df.to_excel(write,'stock')
write.save()
SS=pd.read_excel('D:/stock.xlsx')
Close1=df.Close
ret603533=(Close1-Close1.shift(1))/Close1.shift(1)
ret603533=ret603533.dropna()
ret603533
#**********************************************************
#**********************************************************
#如果是外国的股票:stockfile="^"+stock
#到时候直接打外国股票代码。例:DJI
stock=input("输入股票代號=====>")
stockfile=stock+".SS"
#from pandas_datareader import data as web
write=pd.ExcelWriter('D:/stock.xlsx')
starttime=time.perf_counter()
star=datetime.datetime(2019,1,1)
end=datetime.datetime(2020,6,30)
df=web.DataReader(stockfile,'yahoo',star,end)
df.to_excel(write,'stock')
write.save()
SS=pd.read_excel('D:/stock.xlsx')
Close2=df.Close
ret600519=(Close2-Close2.shift(1))/Close1.shift(1)
ret600519=ret600519.dropna()
ret600519
#**********************************************************
#**********************************************************
stock=input("輸入股票代號=====> ")
stockfile="^"+stock
#from pandas_datareader import data as web
write=pd.ExcelWriter('D:/stock.xlsx')
starttime=time.perf_counter()
start = datetime.datetime(2019,1,1)
end =datetime.datetime(2020,6,30)
df=web.DataReader(stockfile,'yahoo',start,end)
df.to_excel(write,'stock')
write.save()
SS=pd.read_excel('D:/stock.xlsx')
df=web.DataReader(stockfile,'yahoo',start,end)
#***********************************************
Close3 = df.Close
retRTS = (Close3 - Close3.shift(1)) / Close3.shift(1)
retRTS = retRTS.dropna()
retRTS
#**********************************************************
#**********************************************************
stock=input("輸入股票代號=====> ")
stockfile="^"+stock
#from pandas_datareader import data as web
write=pd.ExcelWriter('D:/stock.xlsx')
starttime=time.perf_counter()
start = datetime.datetime(2019,1,1)
end =datetime.datetime(2020,6,30)
df=web.DataReader(stockfile,'yahoo',start,end)
df.to_excel(write,'stock')
write.save()
SS=pd.read_excel('D:/stock.xlsx')
df=web.DataReader(stockfile,'yahoo',start,end)
#***********************************************
Close4 = df.Close
retKS11 = (Close4 - Close4.shift(1)) / Close4.shift(1)
retKS11 = retKS11.dropna()
retKS11
#**********************************************************
#**********************************************************
stock=input("輸入股票代號=====> ")
stockfile="^"+stock
#from pandas_datareader import data as web
write=pd.ExcelWriter('D:/stock.xlsx')
starttime=time.perf_counter()
start = datetime.datetime(2019,1,1)
end =datetime.datetime(2020,6,30)
df=web.DataReader(stockfile,'yahoo',start,end)
df.to_excel(write,'stock')
write.save()
SS=pd.read_excel('D:/stock.xlsx')
df=web.DataReader(stockfile,'yahoo',start,end)
#***********************************************
Close5 = df.Close
retNZ50 = (Close5 - Close5.shift(1)) / Close5.shift(1)
retNZ50 = retNZ50.dropna()
retNZ50
#**********************************************************
#**********************************************************
sh_return=pd.concat([ret603533,ret600519,retRTS,\
retKS11,retNZ50],axis=1)
sh_return.head()
#**********************************************************
#**********************************************************
#查看各股的累积回报率
sh_return = sh_return.dropna()
cumreturn=(1+sh_return).cumprod()
sh_return.plot()
plt.title('Daily Return of 5 Stocks')
plt.legend(loc='lower center',bbox_to_anchor=(0.5,-0.3),\
ncol=5 ,fancybox=True ,shadow=True)
cumreturn.plot()
plt.title('Cumulative Return of 5 Stocks')
#**********************************************************
#**********************************************************
sh_return.corr()
#**********************************************************
#**********************************************************
stocks = pd.concat([Close1,Close2,Close3,Close4,Close5],axis = 1).astype(np.float)
stocks = stocks.dropna()
stocks.columns = ['SS603533','SS600519',' RTS','KS11',' NZ50']
log_ret = np.log(stocks/stocks.shift(1))
np.random.seed(42)
num_ports = 10000
all_weights = np.zeros((num_ports, len(stocks.columns)))
ret_arr = np.zeros(num_ports)
vol_arr = np.zeros(num_ports)
sharpe_arr = np.zeros(num_ports)
#**********************************************************
#**********************************************************
for x in range(num_ports):
    # Weights
    weights = np.array(np.random.random(5))
    weights = weights / np.sum(weights)
    # Save weights
    all_weights[x, :] = weights
    # Expected return
    ret_arr[x] = np.sum((log_ret.mean() * weights * 252))
    # Expected volatilit
    vol_arr[x] = np.sqrt(np.dot(weights.T, np.dot(log_ret.cov() * 252, weights)))
    # Sharpe Ratio
    sharpe_arr[x] = ret_arr[x] / vol_arr[x]
print('Max sharpe ratio in the array :' , format(sharpe_arr.max()))
print('Its location in the array :' , format(sharpe_arr.argmax()))
print('The 5 stocks : ','(1)SS603533','(2)SS600519','(3)RTS','(4)KS11','(5)NZ50')
#get the alloocations in the max
print(all_weights[7068,:])
max_sr_ret = ret_arr[sharpe_arr.argmax()]
max_sr_vol = vol_arr[sharpe_arr.argmax()]
plt.figure(figsize=(12,8))
plt.scatter(vol_arr, ret_arr, c=sharpe_arr, cmap='viridis')
plt.colorbar(label='Sharpe Ratio')
plt.xlabel('Volatility')
plt.ylabel('Return')
plt.scatter(max_sr_vol, max_sr_ret,c='red', s=50) # red dot
plt.show()
#**********************************************************


