python——金融商品收益率GARCH 模型构建(GARCH 模型)
一、GARCH简介
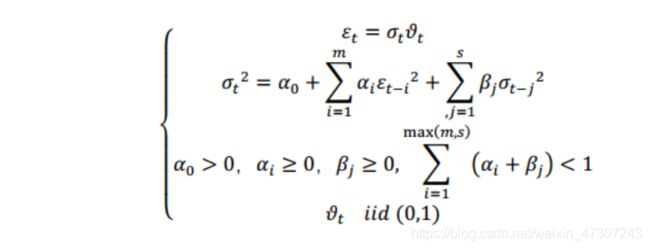
GARCH模型是Bollerslev在1986年提出来的,全称为广义自回归条件异方差模型,Generalized Autoregressive Conditionally Heteroskedastic Models - GARCH(p,q),是ARCH模型的扩展。GARCH模型认为时间序列每个时间点变量的波动率是最近p个时间点残差平方的线性组合,与最近q个时间点变量波动率的线性组合加起来得到。即GARCH模型的条件方差不仅是滞后残差平方的线性函数,还是滞后条件方差的线性函数,因而GARCH模型适合在计算量不大时,方便地描述高阶的ARCH过程,具有更大的适用性。模型的最终结果表示形式为:

其中ωt, 为白噪音,否则模型将是非平稳的。GARCH模型的估计与ARCH模型类似,具体推导过程参见计量经济学相关书籍。在实际应用中,GARCH(1,1)和GARCH(2,1)一般可以满足对自回归条件异方差的描述。下面使用Python对GARCH(1,1)模型进行模拟和估计。
二、读取数据
选取云南白药(000538)
Date
2020-06-22 -0.005435
2020-06-23 0.022186
2020-06-24 0.006308
2020-06-29 0.002869
2020-06-30 -0.006251
Name: Close, dtype: float64
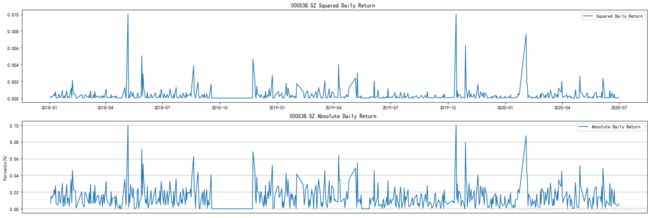
三、绘制000538.SZ 收益率平方序列图
如图所示,大致可观察出收益率序列存在着很明显的波动聚集的现象。因此可初步判断出000538.SZ 收益率序列存在着 ARCH 效应。
四、000538.SZ 序列自相关性
LB检验输出结果:
Out[10]: 1.4317159591174947e-136
检验的p 值明显小于 0.05 ,拒绝000538.SZ收益率序列是白噪声,即无自相关的原假设,即原序列(000538.SZ收益率序列)存在ARCH 效应。
五、000538.SZ 收益率 GARCH 模型构建
接下来是以20181月1日-2020年6月30云南白药(000538)的收益率为研究对象,建立GARCH模型。模型构建步骤为:
1、导入 arch 包中的 arch_model 模块,设定模型;
2、arch_model!默认建立 GARCH(1,1) 模型;
3、估计参数;
4、update 盼 freq=O 表示不输出中间结果;
5、只输出最终结果。
结果输出为:
Optimization terminated successfully. (Exit mode 0)
Current function value: -1578.3210128752269
Iterations: 10
Function evaluations: 76
Gradient evaluations: 6
六、查看结果
Constant Mean - GARCH Model Results
Dep. Variable: Close R-squared: -0.001
Mean Model: Constant Mean Adj. R-squared: -0.001
Vol Model: GARCH Log-Likelihood: 1578.32
Distribution: Standardized Student’s t AIC: -3146.64
Method: Maximum Likelihood BIC: -3124.65
No. Observations: 601
Date: Mon, Dec 07 2020 Df Residuals: 596
Time: 19:49:50 Df Model: 5
Mean Model
coef std err t P>|t| 95.0% Conf. Int.
mu -4.9107e-04 8.928e-04 -0.550 0.582 [-2.241e-03,1.259e-03]
Volatility Model
=============================================================================
coef std err t P>|t| 95.0% Conf. Int.
omega 1.7721e-04 8.150e-04 0.217 0.828 [-1.420e-03,1.775e-03]
alpha[1] 0.0553 0.137 0.403 0.687 [ -0.213, 0.324]
beta[1] 0.4475 2.259 0.198 0.843 [ -3.980, 4.875]
Distribution
========================================================================
coef std err t P>|t| 95.0% Conf. Int.
nu 5.3168 13.388 0.397 0.691 [-20.924, 31.557]
========================================================================
Covariance estimator: robust
根据函数的返回值,模型结果为:
000538.SZRett=-0.00049107+εt
其中:
εt=σtut
σt2=0.00017721+0.0553ε2t-1+0.4475σ2t-1
七、运行代码
#云南白药(000538)
import time
import datetime
import pandas_datareader as web
import pandas as pd
stock=input("輸入股票代號=====> ")
stockfile=stock+".SZ"
#from pandas_datareader import data as web
write=pd.ExcelWriter('D:/stock.xlsx')
starttime=time.perf_counter()
start = datetime.datetime(2018,1,1)
end =datetime.datetime(2020,6,30)
df=web.DataReader(stockfile,'yahoo',start,end)
df.to_excel(write,'stock')
write.save()
SZ=pd.read_excel('D:/stock.xlsx')
df=web.DataReader(stockfile,'yahoo',start,end)
# ********************************************************************
SZindex = df
SZindex.index=pd. to_datetime(SZindex.index)
Close = SZindex.Close
SZiRet = (Close - Close.shift(1)) / Close.shift(1)
SZiRet.tail()
# ********************************************************************
import matplotlib
import matplotlib.pyplot as plt
import numpy as np
%matplotlib inline
plt.rcParams['font.sans-serif'] = [u'SimHei']
plt.rcParams['axes.unicode_minus'] = False
# ********************************************************************
SQSZiRet = SZiRet**2
ABSSZiRet = np.abs(SZiRet)
fig = plt.figure(figsize=(24, 8))
ax = fig.add_subplot(2, 1, 1)
ax.plot(SQSZiRet, label='Squared Dai1y Return')
plt.title(stockfile + ' Squared Dai1y Return ')
ax.legend();
ax2 = fig.add_subplot(2, 1, 2)
ax2.set_xticks(range(0, len(Close.index), 22))
ax2.set_xticklabels(Close.index[::22],rotation=60)
plt.plot(ABSSZiRet,label = 'Abso1ute Dai1y Return ')
plt.ylabel(' Percents(%) ')
plt.title(stockfile + ' Abso1ute Dai1y Return ')
plt.grid(True,axis = 'both')
plt.legend()
plt.show()
# ********************************************************************
from statsmodels.tsa import stattools
from statsmodels.stats.diagnostic import acorr_ljungbox
LjungBox = stattools.q_stat(stattools.acf \
                            (SQSZiRet[1:13]),len(SZiRet))
LjungBox
LjungBox[1][-1]
# ********************************************************************
#导入 arch 包中的 arch_model 模块
from arch import arch_model
#设定模型
#arch_model!默认建立 GARCH(1,1) 模型
am = arch_model(SZiRet) #估计参数
#update 盼 freq=0 表示不输出中间结果, #只输出最终结果
model = am.fit(update_freq = 0)
# ********************************************************************
#拟合399001.SZ数据
SZiRet = SZiRet.sort_index()
SZiRet =SZiRet.dropna()
am = arch_model(SZiRet,p=1,o=0,q=1,dist='StudentsT')
model = am.fit(update_freq=0)
print(model.summary())
# ********************************************************************
