Pyspark比较PCA和SVD
PCA 分解特征向量的协方差矩阵。第一主成分是解释方差最大的成分,各主成分间是相互独立的。每个主成分与原数据具有相同的特征维度。原数据矩阵通过与主成分相乘映射到低维的空间中。
SVD使用矩阵分解的方法将矩阵X近似分解为U*S*V,S为对角矩阵,对角线上的元素被称为奇异值。
SVD相比于PCA的计算更稳定些,但计算需要的内存也更大。
在指定相同成分K时,SVD分解中的V与PCA的主成分几乎相同;U*S与原数据在PCA主成分上的映射一样。
下面就使用Pyspark证明上面这两个结论。
- 准备数据--这里使用人脸数据
# -*- coding: utf-8 -*- '''使用人脸图像进行PCA、SVD比较''' from pyspark import SparkContext, SparkConf sc.stop() conf = SparkConf().setMaster('local[4]').setAppName('image-vectors_app') sc = SparkContext(conf=conf) from sklearn.datasets import fetch_lfw_people import numpy as np import matplotlib.pyplot as plt from pyspark.mllib.linalg import Vectors from pyspark.mllib.linalg import Matrix from pyspark.mllib.linalg.distributed import RowMatrix from pyspark.mllib.feature import StandardScaler lfw_people = fetch_lfw_people(min_faces_per_person=9, resize=0.4) n_samples, h, w = lfw_people.images.shape n_samples, h, w '''(40, 50, 37),总共拉取40张图片,每个图片有50*37个像素组成,height 50,width 37''' X = lfw_people.data vectors = sc.parallelize([Vectors.dense(X[k]) for k in np.arange(len(X)) ]) vectors.cache() # 数据标准化 scaler = StandardScaler(withMean = True, withStd = False).fit(vectors) scaledVectors = scaler.transform(vectors) - PCA和SVD分解
from pyspark.mllib.linalg.distributed import RowMatrix K = 10 # 指定主成分个数 # PCA matrix = RowMatrix(scaledVectors) pc = matrix.computePrincipalComponents(K) rows = pc.numRows cols = pc.numCols print(rows, cols) #OutPut: 1850 10 #SVD svd = matrix.computeSVD(K, computeU = True) print("U dimension: ({}, {})".format(svd.U.numRows(),svd.U.numCols())) print("S dimension: ({},)".format(svd.s.size)) print("V dimension: ({}, {})".format(svd.V.numRows,svd.V.numCols)) '''output: U dimension: (40, 10) S dimension: (10,) V dimension: (1850, 10) ''' - 比较svd.V 与PCA的主成分
# 下面证明 SVD分解出的V 与PCA找出的主成分是一样的 def approxEqual(array1, array2,tolerance = 1e-6,nums = pc.numRows): # 这里忽略PCA和SVD的主成分的正负符号 bools = np.array([ False if (np.abs(np.abs(array1[t]) -np.abs(array2[t])) > tolerance) else True for t in np.arange(len(array2)) ]) if sum(bools ==True) == nums: return True else: return False print([approxEqual(svd.V.toArray().T[k], pc.toArray().T[k]) for k in np.arange(len(pc.toArray().T))]) # output: [True, True, True, True, True, True, True, True, True, True] - 比较svd.U *svd.s 与X*PCA
# 计算数据在PCA主成分上的映射projectedPCArows
projectedPCA = matrix.multiply(pc)
print(projectedPCA.numRows(), projectedPCA.numCols())
projectedPCArows = projectedPCA.rows

# 计算U*S
svdURows = svd.U.rows
svds_brad = sc.broadcast(svd.s)
projectedSVD = svdURows.map(lambda v:v*svds_brad.value)


def approxEqual_DenseVector(vector1,vector2,tolerance = 1e-6,nums =K):
    arr = np.abs(vector1) - np.abs(vector2)
    bools = np.array([ False if np.abs(arr[i]) > tolerance else True for i in np.arange(len(arr)) ])
    if sum(bools == True) == nums:
        return True
    else:
        return False

def approxEqual_rdd(rdd1, rdd2,tolerance = 1e-6,nums = K):
    arr = rdd1.zip(rdd2)
    num_brad = sc.broadcast(nums)
    tol_brad = sc.broadcast(tolerance)
    bools= arr.map(lambda line:approxEqual_DenseVector(line[0],line[1],tolerance=tol_brad.value,nums=num_brad.value))
    return bools

# 比较projectedPCArows 和 projectedSVD
print(approxEqual_rdd(projectedPCArows,projectedSVD).collect())

#output: [True, True, True, True, True, True, True, True, True, True, True, True, True, True, True, True, True, True, True, True, True, True, True, True, True, True, True, True, True, True, True, True, True, True, True, True, True, True, True, True]
以上,证明完毕。
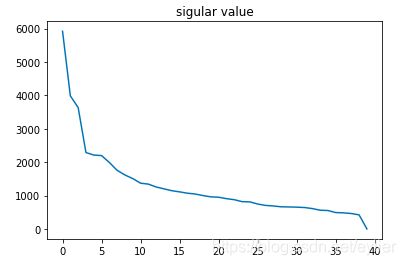
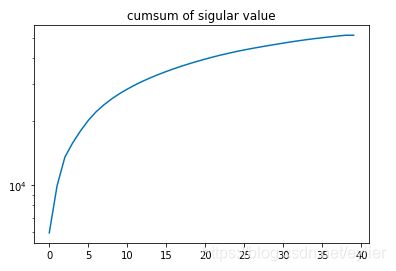
5、绘制陡坡图选择主成分个数K
svd40 = matrix.computeSVD(40, computeU = False)
plt.plot(np.array(svd40.s))

plt.plot(np.cumsum(np.array(svd40.s)))  #或者看累加方差的图形
plt.yscale('log')

